GBP/USD Elliott Wave: Cables are crossing

Executive summary
- Competing wave counts for GBPUSD battle for key level 1.3508.
- Bulls prevail while above 1.3508; while bearish count elevates below 1.3508.
- A large trend is anticipated in the wake of the count prevailing.
Back on January 14, while trading at 1.3428, we forecasted a slight dip, then rally for the beginning stages of wave (iii). Cable has moved generally as forecasted with the current decline from January 27 to February 6 larger than anticipated. This has introduced the potential for a change in the wave count we are following.
GBP/USD Elliott Wave count
We’ve had a good scent on the GBPUSD pattern anticipating further rallies. However, since January 27, the decline to February 6 has become larger than anticipated. No Elliott wave rules have been broken, but we are becoming concerned that another pattern is in development.
Bullish count
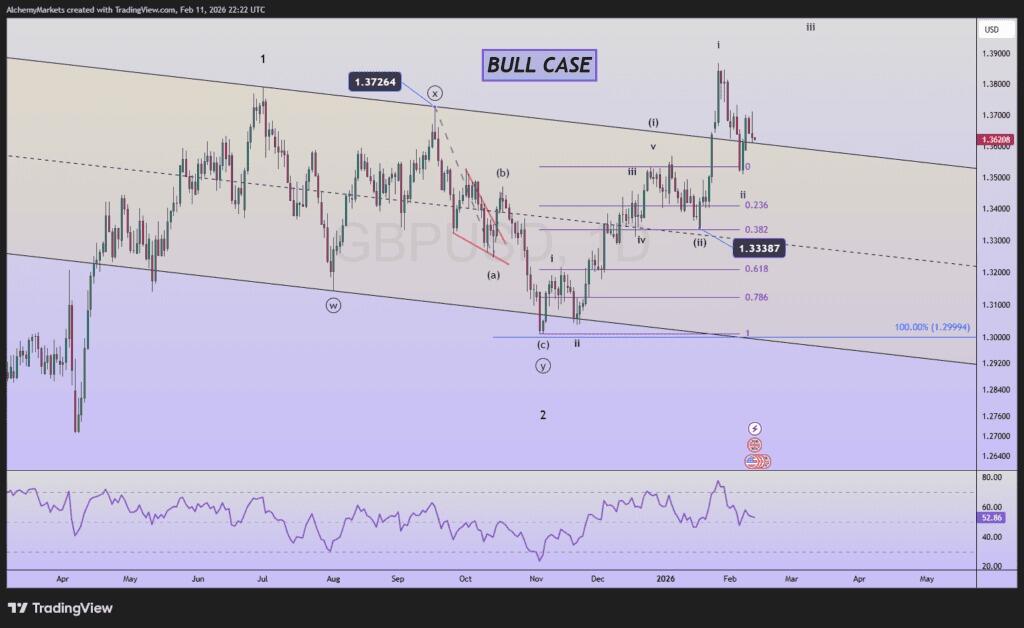
The base bullish case is that wave (ii) ended at 1.3339, just on the edge of our anticipated 1.3125 – 1.3333 reversal zone. Under this bullish wave count, wave ‘i’ of (iii) rallied up to 1.3869 on January 27. The decline to February 6 would be viewed as wave ‘ii’ of (iii).
However, there is an issue with the wave ‘ii’ decline. Wave ‘ii’ is 360 pips while its larger degree wave (ii) is just 147 pips. This is not a rule violation, but with the smaller degree second wave nearly twice the size as it’s larger degree brethren, this presents a reason to pause.
Generally, within an extended wave, the subwaves of the extended wave hold in similar size to the larger degree waves. With the smaller degree at twice the size, we are on the hunt for an alternative count should GBPUSD continue its trend lower.
For this wave count to remain valid, Cable will need to rally immediately and drive up above 1.39.
A retest to the February 6 low of 1.3508 is an early warning dashboard signal that this bullish count may not be the best count.
Bearish alternative count
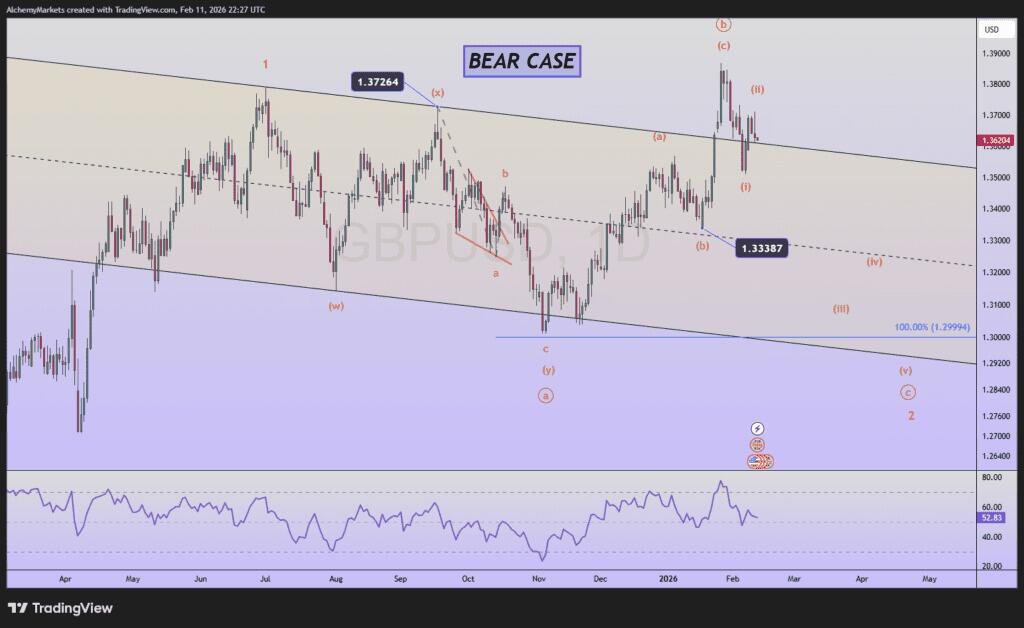
In the event of a breakdown below 1.3508, then we’ll more strongly consider the bearish alternative wave count.
This bearish count points wave ‘2’ not completing at the November low and is still ongoing. The January 27 high is wave ((b)) of 2. This implies the decline from January 27 is the beginning stages of wave ((c)) of 2. This wave is in its infancy and would likely retest the November support low at 1.3010.
Bottom line
GBP/USD appears to be at a crossroads between competing bullish and bearish Elliott wave counts. Though the base case has been for a strong bullish rally, a continued decline to test 1.35 will force us to consider the alternate bearish count.
Author

Zorrays Junaid
Alchemy Markets
Zorrays Junaid has extensive combined experience in the financial markets as a portfolio manager and trading coach. More recently, he is an Analyst with Alchemy Markets, and has contributed to DailyFX and Elliott Wave Forecast in the past.


