Is Gold Set to Rally?

There is little doubt that 2018 has been a rough year for investors and traders alike. Stock favorites like FaceBook and Apple have turned from soaring eagles into quail shot out of the sky. Steady trends have turned into choppy, confusing whipsaws.
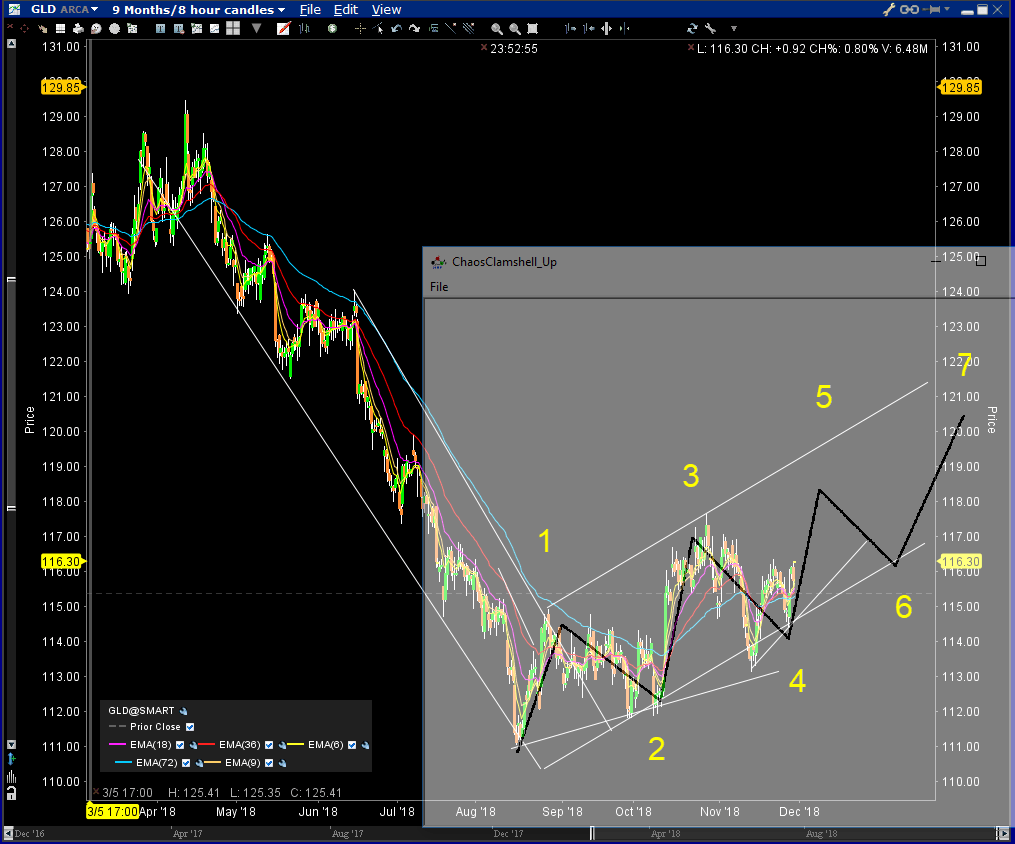
In this climate, gold is often a refuge. This chart of GLD, a popular gold Exchange Traded Fund (ETF) shows that it has stemmed it's decline from earlier in the year. That decline first bottomed in August.
Since then, it has made a 1-2-3-4 pattern of a possible up Chaos Clamshell. The Chaos Clamshell is a 7 move fractal pattern discovered in my research into chaos in markets. It is formed by the laws of how energy adds together. In this pattern, about 60 to 70 percent have move 5 as the biggest and fastest, making it the best move to trade. That move looks to be starting now in gold.
The Chaos Clamshell pattern is one of my eMylar pattern tools. These are simply translucent windows on the Windows operating system. They can be placed over any chart produced by any program. I use this approach for all my courses, so my tools can be used by anyone.
Note that on this chart I am using a rainbow of exponential moving averages, of lengths 6, 9, 18, 36, and 72. With 8 hour bars, these correspond to 2, 3, 6, 12, and 24 days. Gerald Appel's MACD is one of the most popular tools in technical analysis. It is usually formulated as an indicator plotted below price, and it normally uses two averages. I prefer this rainbow approach, because one can still see the converging behavior when energy is not adding well, and the diverging behavior, when energy is adding well, and also the trend.
Note how in the summer decline, the blue 24 day EXMA became the top of the down channel. EXMA's have a property of maximum speed. Once they straighten out, they cannot go faster. They also make good stop guides.
This content was published on Dr. Al Larson's Chaos Clinic which you can attend each Friday for free.
Dr. Al Larson has developed a complete Chaos Model of Markets, four unique courses that let you become a Certified Chaos Trader, some very unique eMylar fractal pattern overlays, and tools that permit forecasting individual stocks and markets years in advance. You can also sign up for a free weekly email, and attend a free Chaos Clinic on Fridays. To learn more, click on the author's profile.
Be sure to sign up for the free weekly email!
Author

Dr. Al Larson, PhD
MoneyTide.com
Dr. Al Larson holds a Ph.D. in Electrical and Computer Engineering from the University of Wisconsin. He is a 1964 Distinguished Graduate of the U. S. Air Force Academy.


