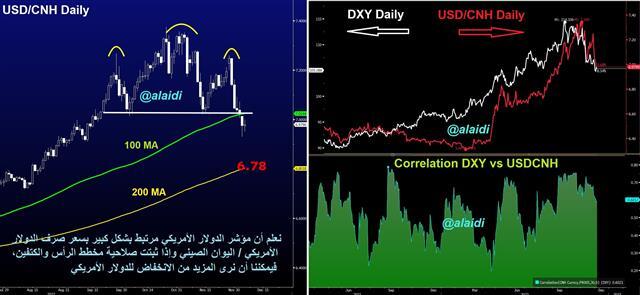
Is CNH Head and Shoulder pattern complete?
On Dec 6th, I posted a chart of the USD/CNH (US dollar vs the Chinese offshore yuan), showing a striking Head & Shoulders formation. 33 days later, the H&S formation is 95-98% complete after USD fell against all major currencies. This also coincides with 10% drop in DXY from its highs. There's that "new" saw in FX about USDCNH or USDCNY becoming the new USDJPY. Regardless, 6.78 on USDCNH represents a nearly complete H&S formation. Does that mean USD has bottomed for now? Does its coincide with a USD recovery on Thursday's release of US CPI? Or, will we see a correction during the 1-2 days before CPI, followed by fresh declines. What does it portend for any coinciding technicals with gold and indices?
Author

FXStreet Team
FXStreet
More from FXStreet Team


