Is a recovery in risk sentiment starting to take hold?

Market Overview
Since China announced on Monday that it would retaliate with a fairly mild increase of tariffs on US imports, there has been a gradual improvement in market sentiment. For a change, some good news surrounding tariffs too. With the US administration delaying a decision on the imposition of tariffs on autos imports by six months, suddenly the glass looks half full again. Add in a smattering of encouraging US data (building permits, jobless claims and the Philly Fed) and we have ourselves a risk rebound. This has driven a reversal in safe haven assets and allowed higher risk plays to rally. Although there is a slight pullback on this risk sentiment early today, there is still a feeling that a recovery of sorts is underway. VIX volatility is pulling back again and bond yields are stabilising. This has been also keenly felt with a sharp move back lower on gold, with US Treasury yields higher. Equity indices have also been making a decisive move higher too, with the DAX and S&P 500 both strongly higher. It is also interesting to see that the dollar, which has been recent days, starting to pull higher once more. Key gauges to watch come with a move below support at $1.1175 on EUR/USD and back above 110 on USD/JPY. With geopolitical tensions in the Middle East again rising, and the improvement in risk, there oil price has started to pull higher again. Look for a breakout on WTI above $63.00/$63.30 to signal a bullish breakout from the recent consolidation.
Wall Street closed decisively higher with the S&P 500 +0.9% at 2876, but with US futures dropped back -0.3% today there has been some of the sheen taken off this rally. Asian markets were mixed overnight, with the Nikkei +0.9% but the Shanghai Composite -2.7%. European markets are lower in early moves. In forex, there is a slightly less positive look to sentiment, with JPY performing better, but little real direction other than continued GBP weakness. In commodities there is a consolidation on gold after yesterday’s corrective move, with oil also consolidating.
The only real economic calendar entry for the European morning comes with the final readings of April Eurozone inflation at 1000BST. There is an expectation that the flash readings will be confirmed for Eurozone headline HICP at 1.7% (1.7% flash, +1.4% in March), with Eurozone core HICP at +1.2% (+1.2% flash, +0.8% March). The US session will be looking at prelim Michigan Sentiment for May at 1500BST. Consensus expects a slight improvement to 97.5 (from the final reading of 97.2 in April).
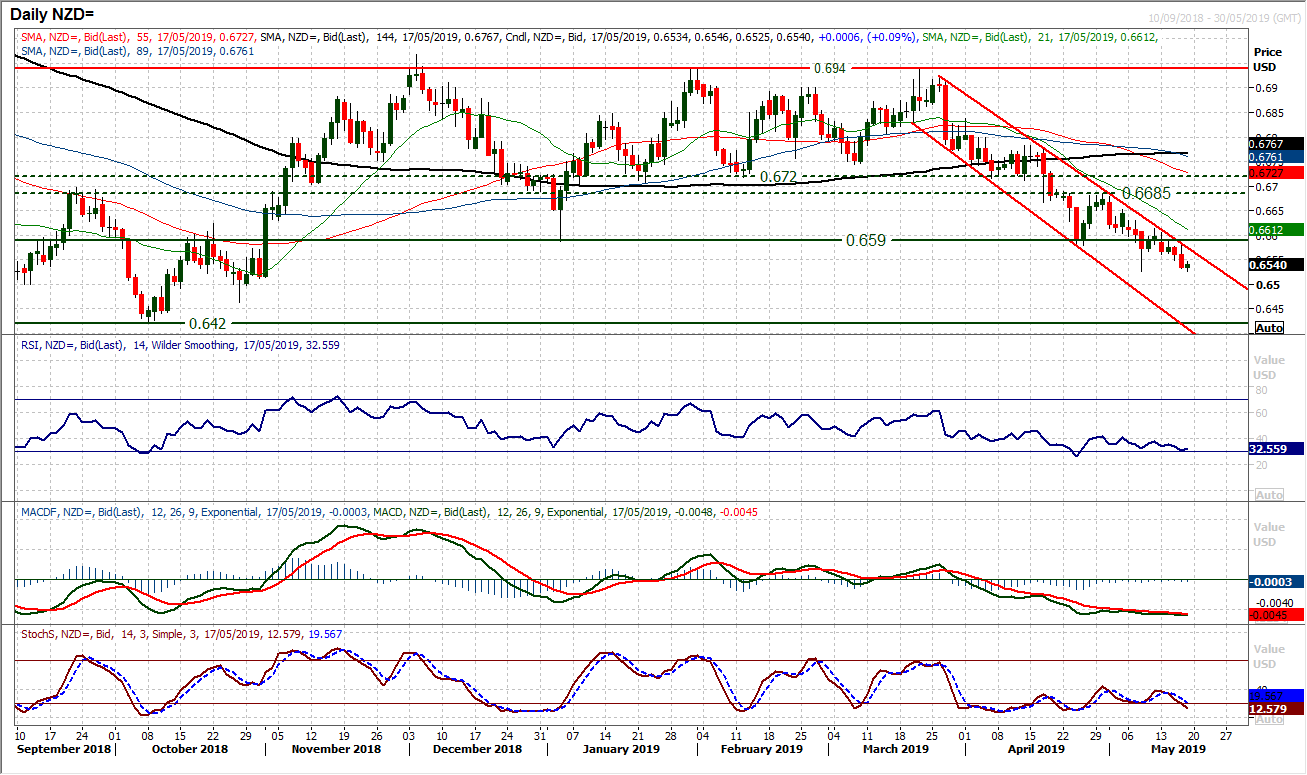
Chart of the Day – NZD/USD
Rallies to the downtrend channel resistance are a chance to sell. We have been looking at selling into near term strength since the market broke the support at $0.6590. This old key low has become an area of overhead supply and throughout the past week this along with the channel downtrend of the past seven weeks gives another opportunity for further downside to test $0.6525 initially. Momentum indicators remain decisively negatively configured. The RSI is continually struggling around 40 and in the low 30s still has further downside potential. The same can be said for the Stochastics which have crossed lower this week. Yesterday’s intraday rally failed bang on the channel resistance leaving another lower high. The resistance of the channel comes in around $0.6575 today. There is little real support until the October/November lows $0.6420/$0.6465.
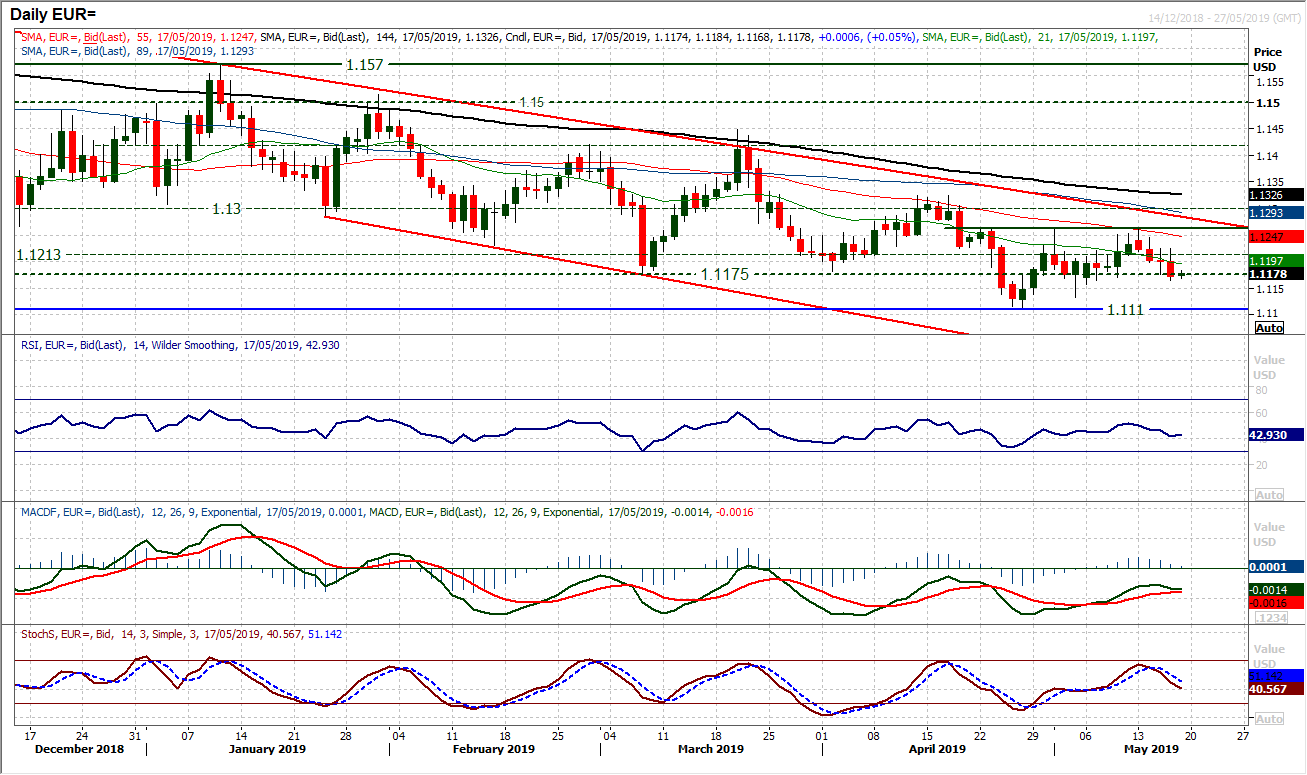
EUR/USD
With the dollar regaining some lost ground, there have been four consecutive negative sessions now on EUR/USD. This comes as momentum indicators roll over and downside pressure grows. The old $1.1175 key March low is a gauge and the market is increasingly pressuring this level which has again been supportive recently. The hourly chart shows a more corrective configuration forming, with hourly RSI failing at 60 and pushing below 30, whilst hourly MACD lines are also consistently below neutral. A basis of a pivot resistance has built up around $1.1220 below the $1.1265 key near term resistance. A move below $1.1165 would suggest the bulls are losing their grip and a retest of $1.1110 taking hold.
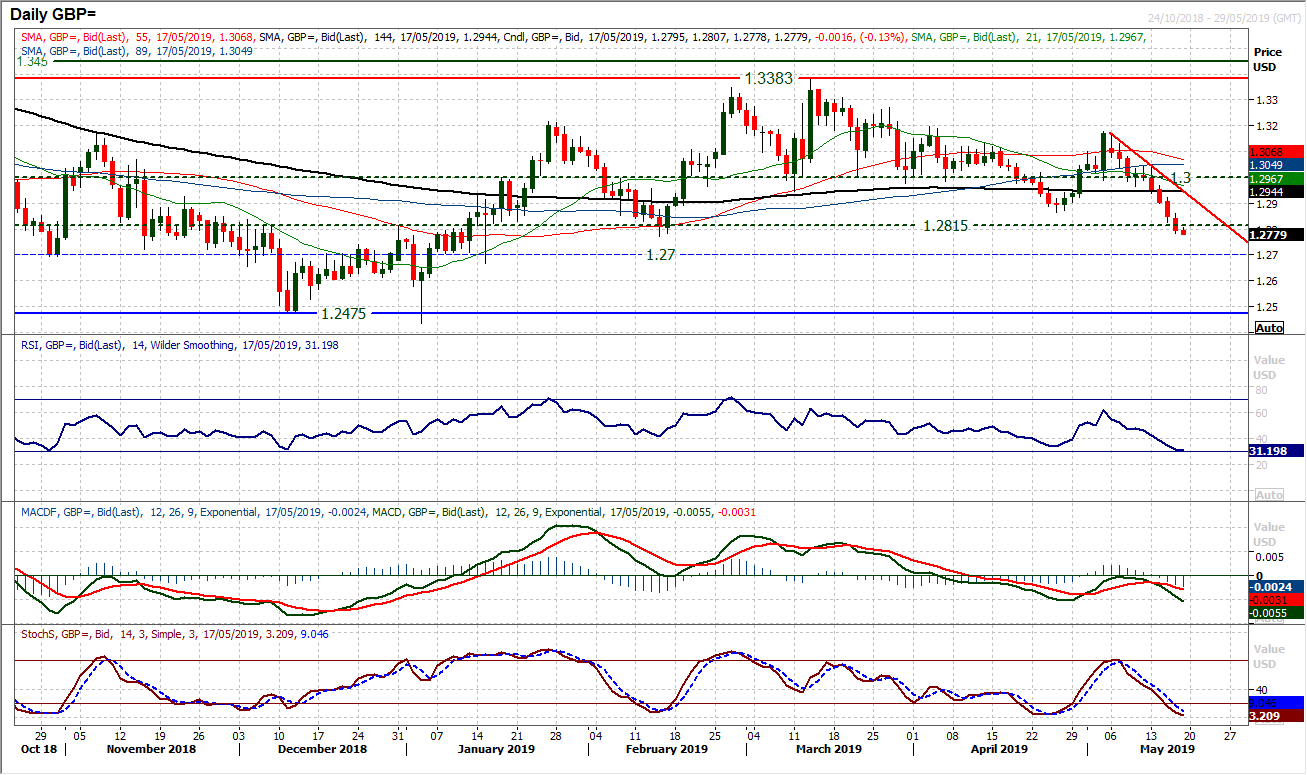
The prospects for sterling are looking increasingly negative. The acceleration lower in the past week has broken a series of supports and is now eyeing the key reaction low at $1.2770. The concern is that the MACD lines are increasingly negatively configured, with the acceleration from the bear cross below neutral. The RSI is still in the low 30s and there is further downside potential. A closing breach of $1.2770 would be a significant downside break, opening initially $1.2700 but potentially the crucial December lows around $1.2475 again. There is overhead supply now between $1.2815/$1.2865.
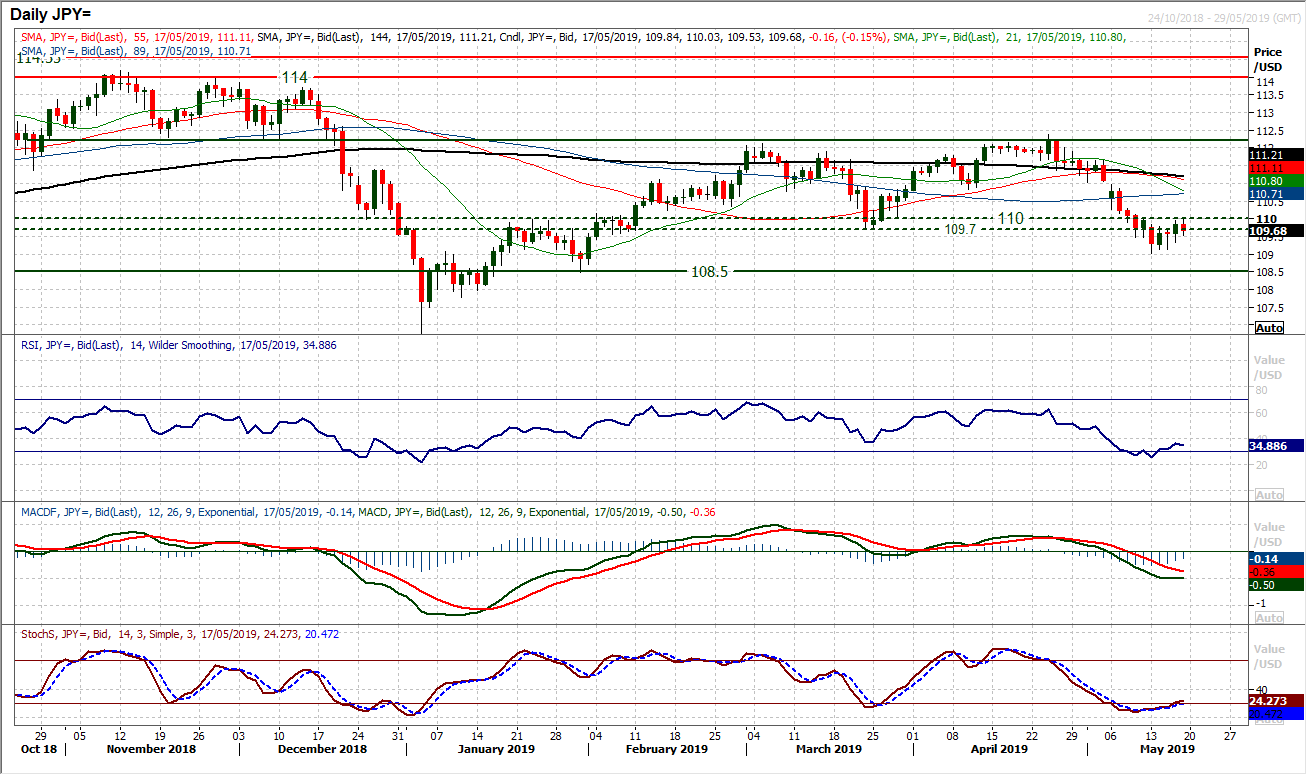
USD/JPY
The negative momentum of the decline has dissipated in the past few sessions as risk appetite has started to improve. As support at 109.00 has grown the market has been building to test the overhead supply of the old key March low (at 109.70). There is a resistance band 109.70/110.00 which is now a key gauge for the near term outlook. Yesterday’s bull candle looked set to really put pressure on this resistance, but a drop back early today shows that this is a level the market clearly puts importance on near term. A close back above this band would improve the near term outlook for potential renewed dollar strength against the yen. With the momentum indicators trying to bottom, this looks to be a key crossroads for the pair. A bull failure (a close back under 109.70) would be a disappointment, but all would not be lost. There is a run of higher daily lows in the past few sessions, with yesterday’s low at 109.30 as initial support. A continued run of higher lows would maintain the improvement.
Gold
A sharp reversal on gold has broken the recovery breakout from Monday. Risk aversion of the escalation in the trade dispute has dissipated and with the dollar regaining strength we have seen a bull failure on gold. We have previously been discussing as to how the market would respond to the breach of the 11 week downtrend. With the pullback below the breakout support band $1289/$1291, the prospect of a sustained recovery has been significantly reduced. Closing back below the previous breakout support at $1289/$1291 serves as a disappointment for the bulls now. A two week uptrend has also been broken to scupper the immediate prospects of recovery. The near term outlook is mixed following this bull failure and focus turns back on the old pivot support $1278/$1279. If this pivot is breached then the market will really be turning corrective again. On the hourly chart the hourly RSI is now failing around 60 and a more corrective outlook forming again. If $1291 becomes a pivot resistance the pressure will mount on $1278/$1279 again.
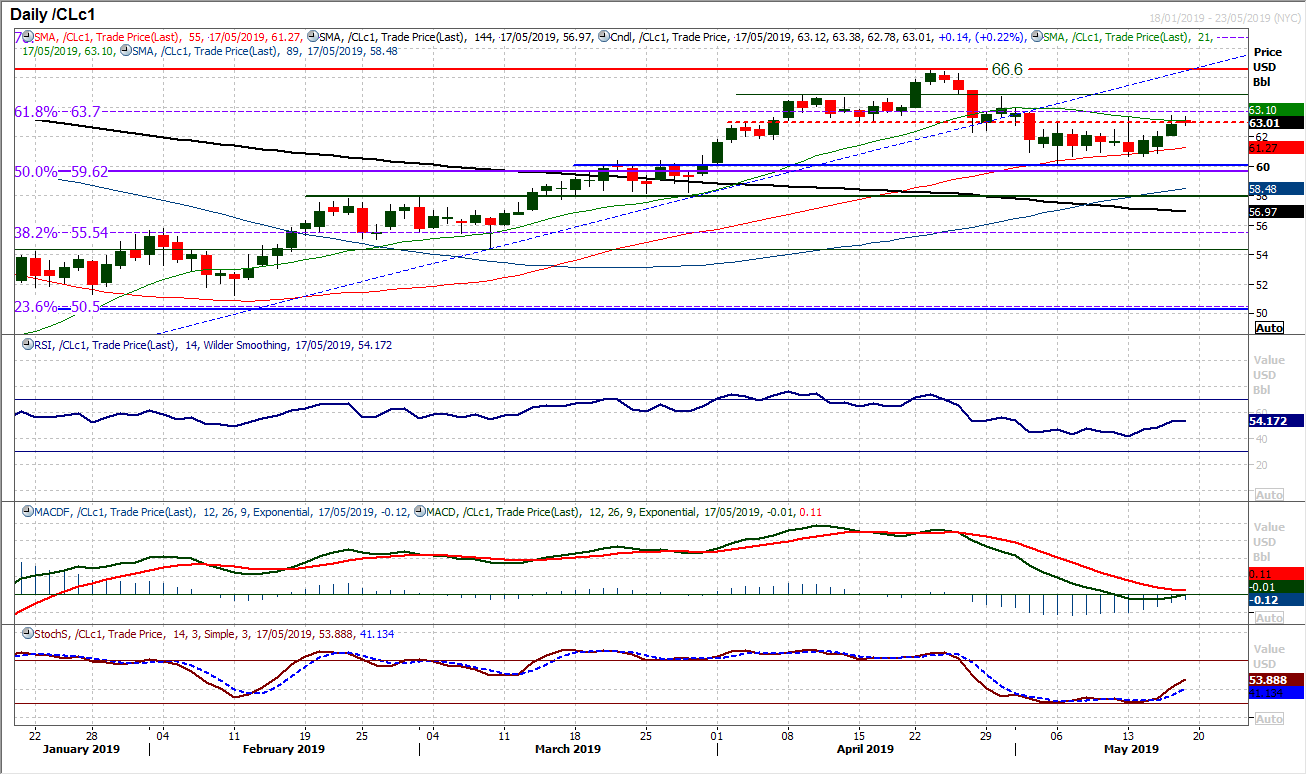
WTI Oil
With risk appetite turning more positive and this has helped oil higher. Three positive candles in a row have threatened a breakout of recent consolidation and the outlook is on the brink of turning more positive again. An intraday move through $63.00 resistance builds on the improvement but needs a closing breakout. Daily momentum indicators are responding, with a bull cross on Stochastics, RSI pulling above 50 and MACD lines starting to bottom. This is bolstering the importance of support at $60.00 and the bulls are now looking to buy into intraday weakness. The hourly chart shows a band of breakout support $62.50/$63.00 which is now a near term buy zone. Closing above $63.50 confirms the bulls back in control and an old pivot at $64.80 as the next resistance.
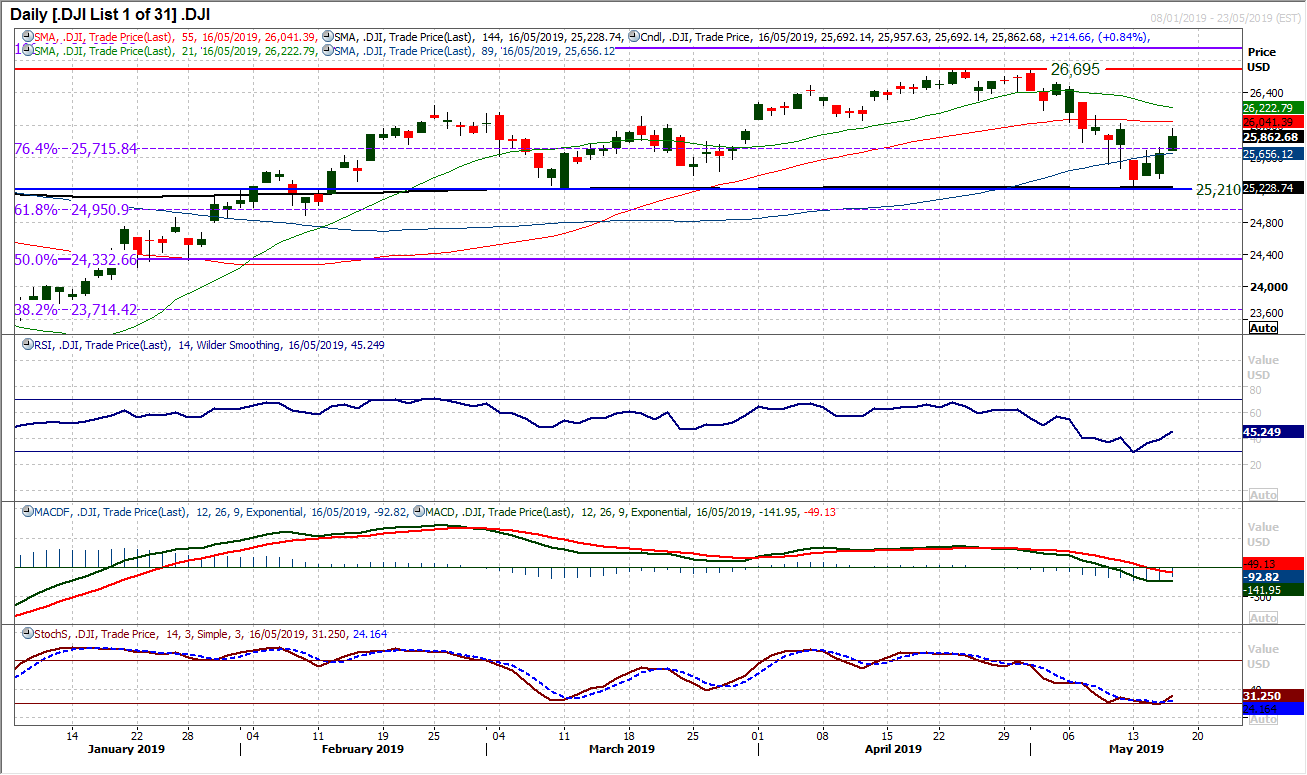
Dow Jones Industrial Average
Three positive candles in a row seem to be showing the bulls bouncing back. The most important factor on the medium to longer term chart is the defence of key support at 25,210. A breach of the March low would now form a big head and shoulders top pattern. However, for now this is being supported, whilst a close back above the 76.4% Fibonacci retracement improves the outlook again. However, there is more that needs to be done for the recovery to be sustained. The first key resistance at 26,019 needs to be breached to signal a renewed formation of a positive trend. Momentum indicators (RSI and Stochastics) have ticked higher but the MACD lines are still questionable aa shade below neutral. Building support above the near term breakout at 25,690/25,720 would help build stronger foundations for the bulls.
Author

Richard Perry
Independent Analyst


