IRA signed into law [Video]
![IRA signed into law [Video]](https://editorial.fxstreet.com/images/Markets/Equities/HangSeng/hang-seng-index-17354816_XtraLarge.jpg)
US Dollar: Sep '22 USD is Up at 106.440.
Energies: Sept '22 Crude is Down at 86.35.
Financials: The Sep '22 30 Year bond is Down 20 ticks and trading at 140.19.
Indices: The Sep '22 S&P 500 emini ES contract is 66 ticks Lower and trading at 4291.25.
Gold: The Dec'22 Gold contract is trading Down at 1788.90. Gold is 8 ticks Lower than its close.
Initial conclusion
This is not a correlated market. The dollar is Up, and Crude is Down which is normal, but the 30-year Bond is trading Lower. The Financials should always correlate with the US dollar such that if the dollar is lower, then the bonds should follow and vice-versa. The S&P is Lower, and Crude is trading Lower which is not correlated. Gold is trading Lower which is correlated with the US dollar trading Up. I tend to believe that Gold has an inverse relationship with the US Dollar as when the US Dollar is down, Gold tends to rise in value and vice-versa. Think of it as a seesaw, when one is up the other should be down. I point this out to you to make you aware that when we don't have a correlated market, it means something is wrong. As traders you need to be aware of this and proceed with your eyes wide open. All of Asia is trading Higher. Currently all of Europe is trading Lower with the exception of the Milan exchange which is trading Higher.
Possible challenges to traders today
-
Core Retail Sales is out at 8:30 AM EST. Major.
-
Retail Sales is out at 8:30 AM EST. Major.
-
FOMC Member Bowman Speaks at 9:30 AM Major.
-
Business Inventories is out at 10 AM EST. Major.
-
Crude Oil Inventories is out at 10:30 AM EST. Major.
-
FOMC Meeting Minutes is out at 2 PM EST. Major.
-
FOMC Member Bowman speak at 2:20 PM. Major.
Treasuries
Traders, please note that we've changed the Bond instrument from the 30 year (ZB) to the 10 year (ZN). They work exactly the same.
We've elected to switch gears a bit and show correlation between the 10-year bond (ZN) and the S&P futures contract. The S&P contract is the Standard and Poor's, and the purpose is to show reverse correlation between the two instruments. Remember it's likened to a seesaw, when up goes up the other should go down and vice versa.
Yesterday the ZN made its move at around 10 AM EST. The ZN hit a Low at around that time and the S&P moved Lower shortly thereafter. If you look at the charts below ZN gave a signal at around 10 AM EST and the S&P moved Lower at around the same time. Look at the charts below and you'll see a pattern for both assets. ZN hit a Low at around 10 AM EST and the S&P was moving Lower shortly thereafter. These charts represent the newest version of MultiCharts and I've changed the timeframe to a 15-minute chart to display better. This represented a Long opportunity on the 10-year note, as a trader you could have netted about 20 ticks per contract on this trade. Each tick is worth $15.625. Please note: the front month for the ZN is now Sep '22. The S&P contract is also Sep' 22 as well. The front months are now Sep' 22. I've changed the format to Renko Bars such that it may be more apparent and visible.
Charts courtesy of MultiCharts built on an AMP platform
ZN - Sep 2022 - 08/16/22
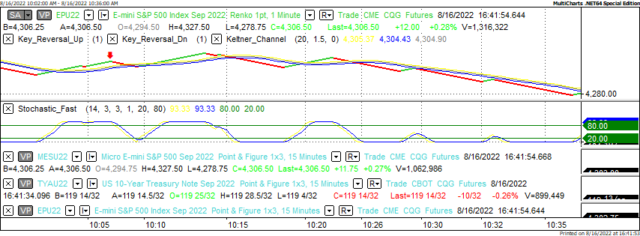
S&P - Sep 2022 - 08/16/22
Bias
Yesterday we gave the markets a Neutral bias as the USD and the Bonds weren't trading in the same direction and that usually signifies a Neutral or Mixed Day. The markets didn't disappoint as the Dow and S&P both traded Higher, but the Nasdaq closed Lower. Today we aren't dealing with a correlated market and our bias is Neutral.
Could this change? Of Course. Remember anything can happen in a volatile market.
Commentary
Well, the IRA was finally signed into law yesterday and what should have been an Up day was more of a Neutral or Mixed one. The Dow traded Higher by 240 points, the S&P by 8 but the Nasdaq dropped 26, making it a Mixed day. This was what we suggested yesterday morning as we didn't see much in the way of correlation and when that happens it tells you to beware because anything can happen. Case in point, Biden signs the Inflation Reduction Act and that should have been cause for an Up day with the bulls roaring. Well, that didn't happen. Today we have more ion the way of economic news as well as the Fed Meeting Minutes which is always a market mover.
Author

Nick Mastrandrea
Market Tea Leaves


