Inverted Yield Curve: It’s Definitely Not Different This Time

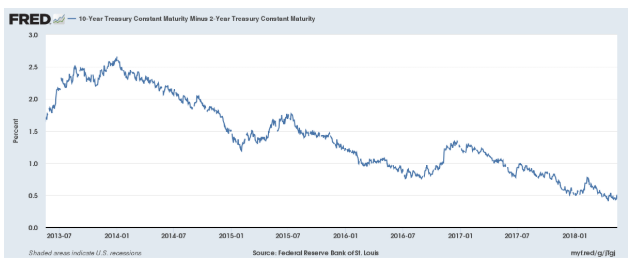
An inverted yield curve occurs when the yield on shorter-dated securities is above that on longer-term bonds; and it has predicted all nine U.S. recessions since 1955, according to Bloomberg. Of course, now that the yield curve is the flattest since 2007—with the 2-10 spread falling to just 45 basis points, from 260bps in 2014--right on cue the carnival barkers on Wall Street have been deployed in full force claiming this key financial barometer is now broken.
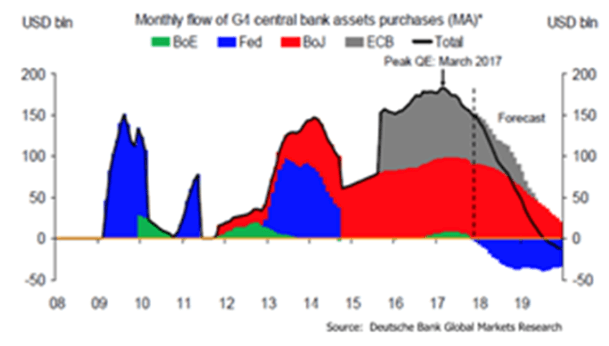
The crux of their claim is that the long end of the yield curve is falling and the spread is narrowing solely due to central bank purchases; and it has absolutely nothing to do with the impaired condition of the global economy due to the massive debt overhang. However, their rational of blaming central bank intervention as the primary culprit falls apart because the yield spread continues to decline despite the fact that QE has been in the process ending for over a year. Global QE has been steadily declining from $180 billion per month worth at its apex in early 2017 and will most likely fall to zero by the end of this year. And yet, the yield curve continues to decline.
Nevertheless, this spread is contracting just as the amount of global QE is falling.
If the synchronized global growth situation was still indeed a fact, long term bond yields would be rising at least as fast as short-term rates were rising. Hence, yield spreads would not be contracting.
More importantly, even If the perm-bulls were correct about the reason why the yield curve is about to invert, it still doesn't change the forces that are always released after such an event occurs. Namely, that the income earned on new bank loans is less than the amount paid to depositors. This means, loan volume and the money supply--the fuel that inflates asset bubbles--plummets rather sharply and those same asset prices crash in violent fashion.
Given the near 5% level of nominal GDP displayed in the U.S. recently, which is where the 10-year Note yield normally trades, theisBenchmark rate should already be yielding at least two hundred basis point higher than its current 3%. And with the additional consideration of $1 trillion deficits as far as the eye can see and a $22 trillion National Debt (105% of GDP), there isn't any reason why that yield should be anywhere near 3%.
The excuse is simply pushed overseas: yields are incredibly low here in the U.S. because yields are historically low in Europe. This is true. But, for example, the question must be answered as to why the German 10-year Bund yields just 0.5% even though the European Central Bank under Mario Draghi has cut the amount of QE drastically. From April 2016 until March 2017, the average monthly pace of QE was €80 billion, but it is now just €30 billion. And during the time that the ECB’s bond buying program has been cut by over 62%, the yield on the German Benchmark lending rate has increased by a grand total of just 8 bps.
Therefore, the reason why bond yields remain at incredibly low levels in Europe, Japan and the US isn't just about the dwindling vestiges of QE; but much more about a perpetual state of economic anemia brought on by debt-disabled economies throughout the globe. And, most assuredly, about the international bond traders who are keenly aware of the fast approaching deflationary depression arising from the removal of central bank crutches.
Of course, it’s not just the massive QE program from the ECB that is quickly disappearing into the rearview mirror. The Fed's Quantitative Tightening experiment, which is an autopilot sell program consisting of the indiscriminate dumping of $600 billion worth of Mortgage Backed Securities and Treasury Bonds, is going to cause an asset price implosion of historic proportions.
Objective market strategists understand that the yield curve will soon invert and the ramifications of such an event will be the same as they always have been in the past. The only difference being that this next financial crisis will bring about a protracted global recession/depression. This is because the bursting of the gargantuan bond bubble is occurring in the context of aggregate debt levels and asset valuations that are far greater than at any other time in history. The Main Stream Financial Media gives a voice to stock market cheerleaders with alacrity. Nevertheless, they are leading investors astray just as they did prior to the NASDAQ implosion in 2000 and the Great Recession of 2008. Those are the last two occasions when the yield curve inverted and caused investors to lose most of their retirement nest egg. But that doesn’t mean you have to be a victim yet again.
Author

Michael Pento
Pento Portfolio Strategies
Mr. Michael Pento is the President of Pento Portfolio Strategies and serves as Senior Market Analyst for Baltimore-based research firm Agora Financial. Pento Portfolio Strategies provides strategic advice and research for institutional clients.


