Intensifying Middle East conflict bolsters Gold price

Escalating tensions in the Middle East ahead of the U.S. The President's visit to Israel cast a shadow. Against this backdrop, gold and oil prices rallied amid stalled ceasefire efforts in Gaza.
Escalating tensions in the Middle East cast a shadow as the anticipated visit of the U.S. President to Israel looms on Wednesday. Against this backdrop, gold and oil prices rallied amid stalled ceasefire efforts in Gaza. Meanwhile, U.S. equity markets adopted a cautious stance, influenced by economic data reinforcing expectations of a prolonged period of higher interest rates, with a potential rate hike anticipated in December. In a parallel development, Japan's long-term bond yields surged to levels unseen since 2013, edging closer to the yield curve control (YCC) ceiling. Market watchers are on alert for potential intervention by Japanese authorities in response to these market dynamics.
Market movements
Dollar Index
The US Dollar displayed resilience amidst mixed market sentiment. Positive news from the Census Bureau, reporting higher-than-expected Retail Sales figures, provided some support. However, dovish expectations from the Federal Reserve tempered the dollar's strength.
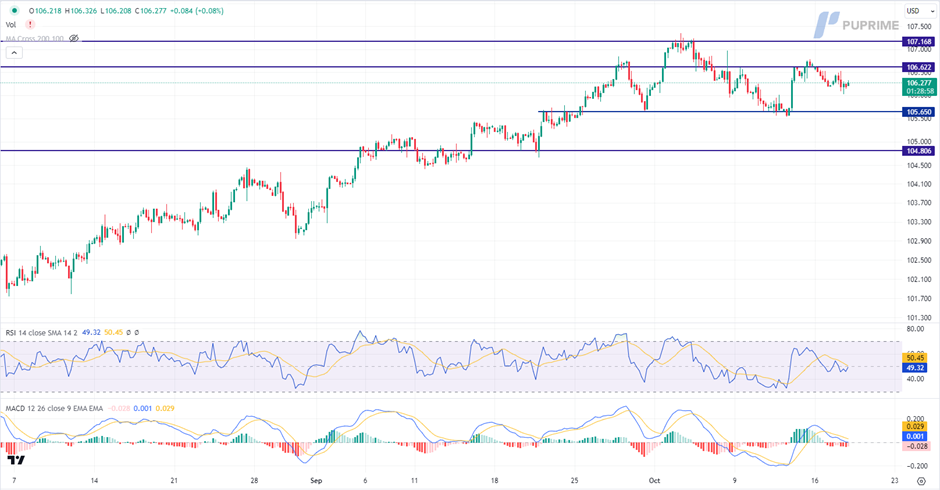
The Dollar Index is trading lower following the prior retracement from the resistance level. MACD has illustrated increasing bearish momentum, while RSI is at 49, suggesting the index might extend its losses toward support level since the RSI stays below the midline.
Resistance level: 106.60, 107.15.
Support level: 105.65, 104.80.
XAU/USD
Gold's recent resilience is notable, driven by dovish Federal Reserve expectations and rising Middle East tensions. Investors are drawn to the precious metal due to expectations of a less hawkish monetary policy and its traditional role as a safe-haven asset in times of geopolitical instability. Meanwhile, US President Joe Biden's visit to Israel is pivotal in curbing conflict escalation. On the global stage, a meeting between Chinese President Xi Jinping and Russia's Vladimir Putin is expected to address calls for easing Middle East tensions, further influencing gold's trajectory.
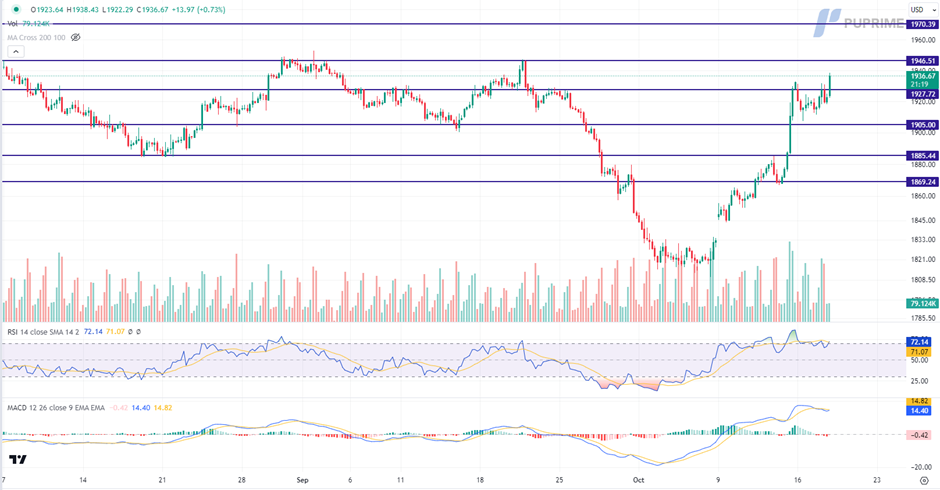
Gold prices are trading higher following the prior breakout above the resistance level. MACD has illustrated increasing bearish momentum, while RSI is at 72, suggesting the commodity might enter overbought territory.
Resistance level: 1945.00, 1970.00.
Support level: 1925.00, 1905.00.
EUR/USD
The EUR/USD pair's upward trajectory faced resistance as robust U.S. economic data, particularly higher-than-expected retail sales figures, raised speculation about another Fed rate hike before the year's end. Attention now turns to the Eurozone's CPI data, slated for release today. Market consensus anticipates a decrease from the previous reading, signalling a potential softening of inflation within the economic bloc.
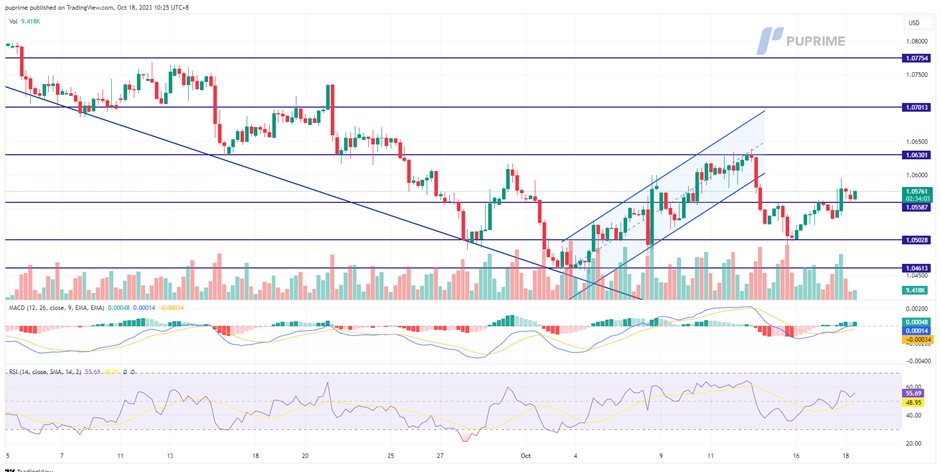
EUR/USD faces resistance at the 1.0580 level, but the bullish momentum is seemingly intact with the pair. The RSI is moving upward while the MACD is breaking above the zero line, suggesting the bullish momentum remains.
Resistance level: 1.0630, 1.0750.
Support level: 1.0500, 1.0460.
USD/JPY
The Japanese yen exhibited significant weakness, with the USD/JPY pair nearing 150. This prompted market watchers to remain vigilant for potential intervention by Japanese authorities. Moreover, reports of the Bank of Japan considering adjustments to its core CPI forecasts for 2023 and 2024 while maintaining the inflation outlook for 2025 added further layers of uncertainty to the USD/JPY trend.
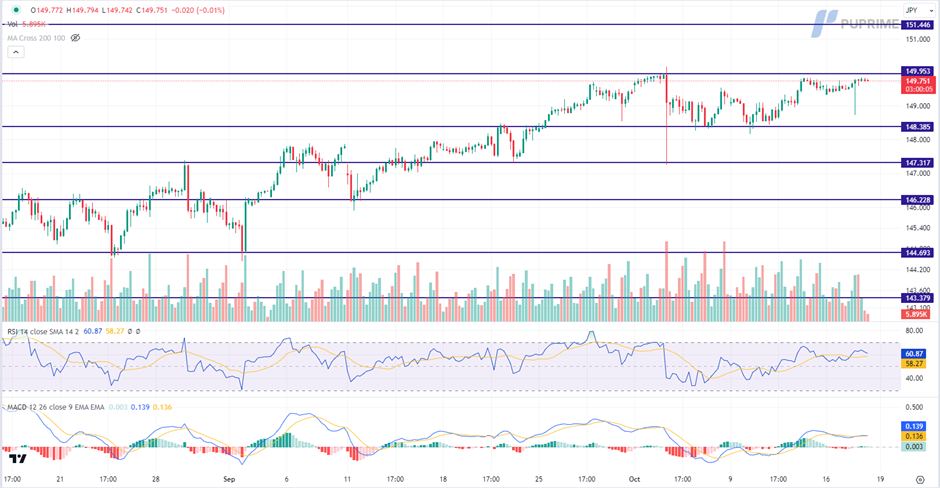
USD/JPY is trading higher while currently testing the resistance level. However, MACD has illustrated diminishing bullish momentum, while RSI is at 61, suggesting the pair might be experiencing technical correction since the RSI retreated from its overbought territory.
Resistance level: 149.95, 151.45.
Support level: 148.40, 147.30.
Dow Jones
US Treasury yields surged, while stocks faced challenges following the robust economic data. The solid numbers reinforced expectations of a prolonged period of higher interest rates. Two-year US yields reached levels not seen since 2006. Nvidia experienced a setback as the US government-imposed restrictions on chip sales designed for the Chinese market, escalating trade tensions between the two nations. This move added further uncertainty to an already complex US-China relationship.As for now, investors will continue to look forward to more corporate earnings reports this week for further trading signals.
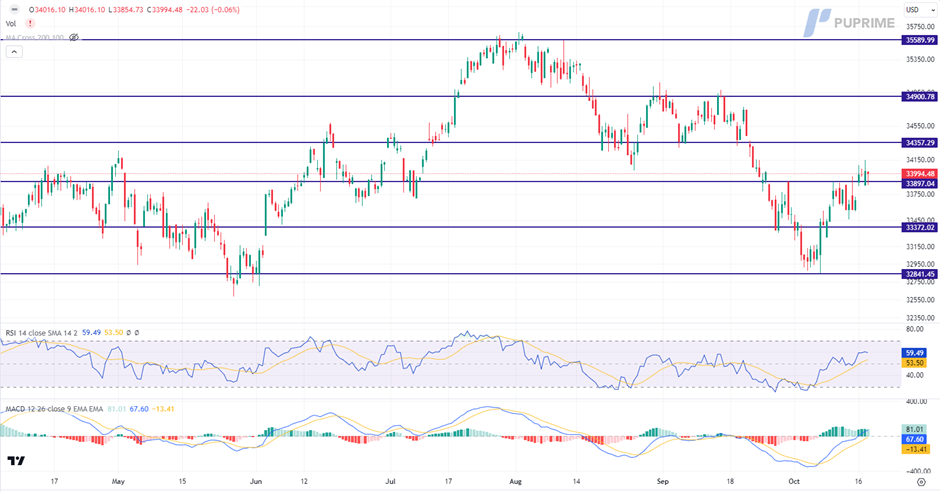
The Dow is trading higher following the prior breakout above the resistance level. MACD has illustrated increasing bullish momentum, while RSI is at 59, suggesting the index might extend its gains since the RSI stays above the midline.
Resistance level: 34355.00, 34900.00.
Support level: 33900.00, 33370.00.
GBP/USD
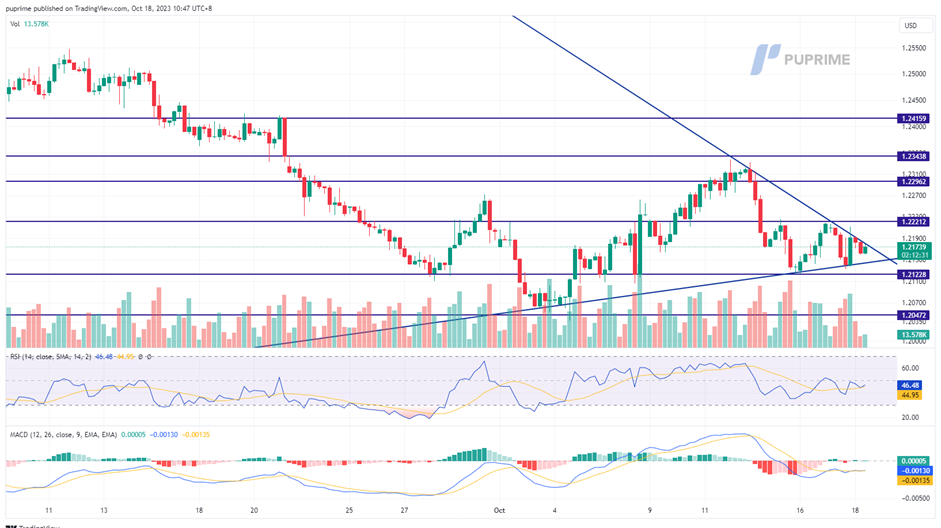
The GBP/USD pair has formed an asymmetric triangle pattern, indicating a period of uncertainty and indecision in the market. The robustness of the U.S. dollar, supported by recent strong economic data, contrasts with the cautious stance of investors awaiting key U.K. economic indicators. Eyes are on the release of U.K.'s CPI data today and Retail Sales data on Friday, pivotal factors influencing Sterling's direction in the near term.
The Cable is trading in an asymmetric triangle pattern and is clueless on what direction the Cable is heading. The RSI and the MACD remained flat giving a neutral signal for the pair as well.
Resistance level: 1.2220, 1.2300.
Support level: 1.2120, 1.2050.
AUD/USD
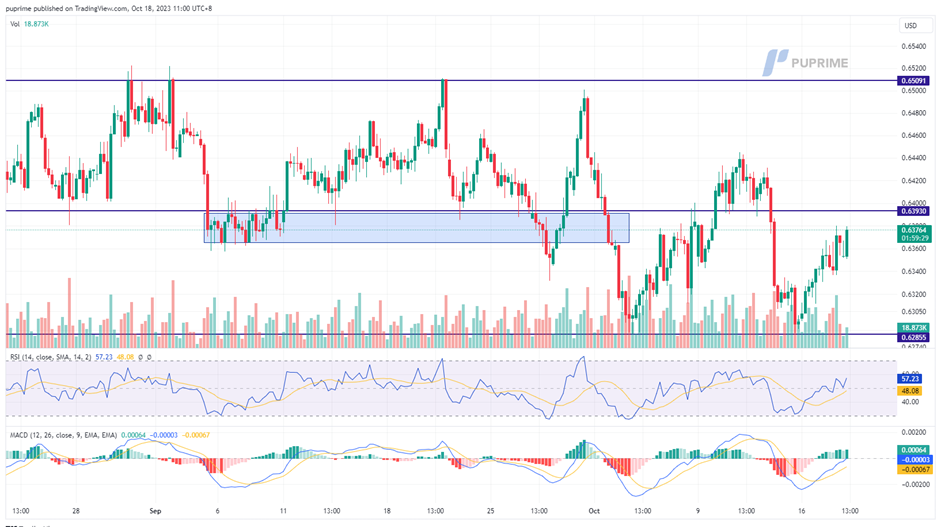
The Australian dollar remains resilient against the strong USD, buoyed by the RBA's Hawkish September Meeting Minutes. Despite the USD's strength from upbeat U.S. economic data and Middle East tensions, the Aussie holds its ground. Additionally, China's better-than-expected GDP figures further support the Aussie, reflecting its stability amidst global uncertainties.
The Pair has formed a double-bottom price pattern and is currently trading upward, suggesting a strong bullish bias. The RSI and the MACD are moving upward, suggesting the bullish momentum is forming.
Resistance level: 0.6400, 0.6510.
Support level: 0.6280, 0.6200.
CL Oil
The oil market maintained a flat stance as investors closely monitored US diplomatic endeavours. President Biden's visit to Israel held the potential to curb the expansion of the Middle East conflict. Furthermore, the possibility of increased oil supply loomed as Venezuela's government and opposition resumed talks, potentially leading to a relaxation of US sanctions.
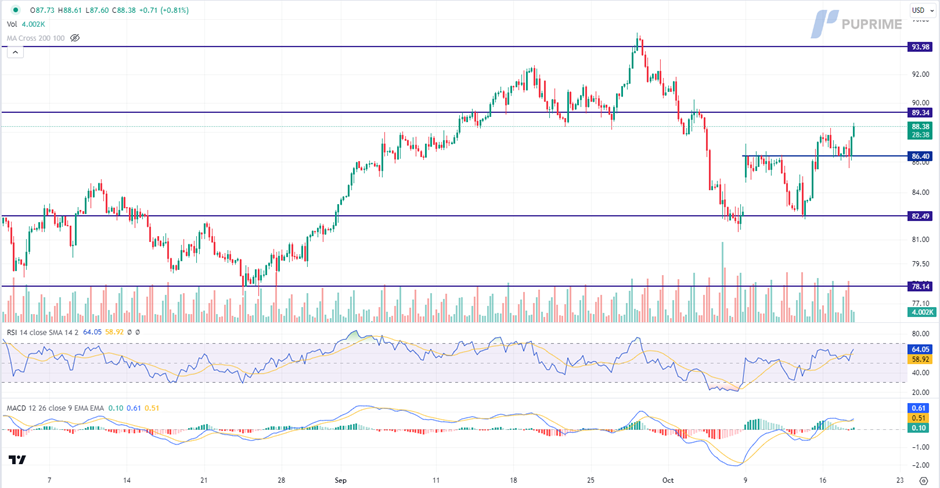
Oil prices are trading higher following the prior rebound from the support level. MACD has illustrated increasing bullish momentum, while RSI is at 64, suggesting the commodity might extend its gains toward resistance level since the RSI stays above the midline.
Resistance level: 89.35, 94.00.
Support level: 86.40, 82.50.
Author

PU Prime team
PU Prime
PU Prime is an award-winning CFD broker offering clients access to multiple products across multiple asset classes. Traders will have access to FX, Commodities, Indices, Share CFDs and Bonds.


