Inflation week
The second week of the month usually has relatively few indicators. The main feature is the US consumer price index (CPI), as well as the UK and Canada CPIs. It’s a good time to review where we are with regard to inflation.
The big question earlier this year, as inflation surged everywhere, was whether these higher rates were structural – in case central banks would have to respond with tighter policies – or whether they were due mostly to distortions caused by the reopening of economies, in which case they were likely to fade as supply chains readjust and things get back to normal. That would justify the consensus among central banks that the higher rates are “transitory” and therefore don’t warrant a tightening of policy.
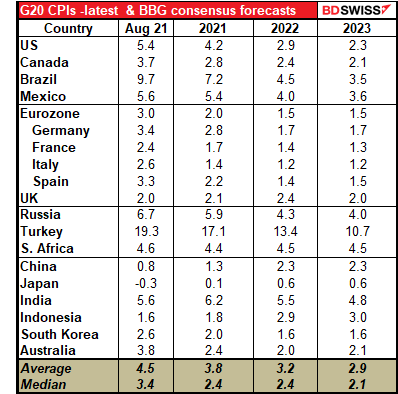
Looking at the G20 countries, almost all have seen an acceleration of inflation over the last three months.
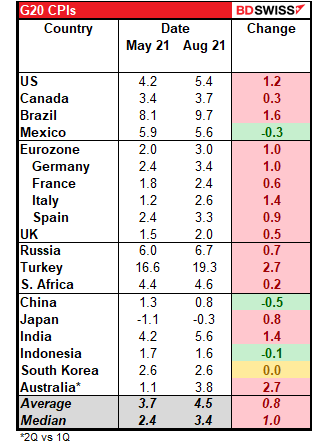
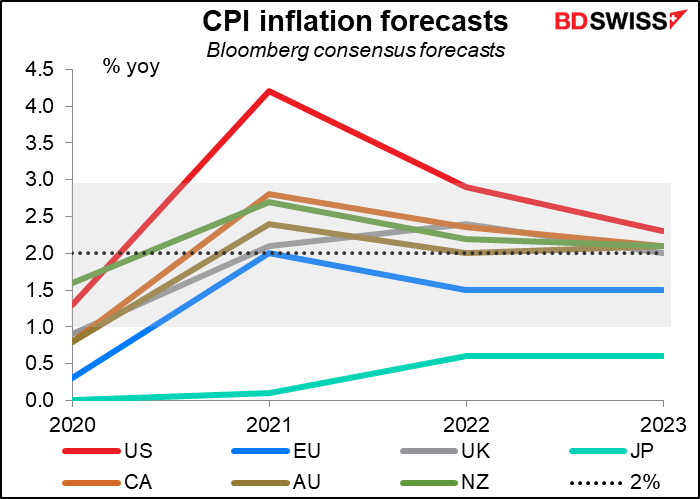
However, this isn’t expected to last. Most countries are expected to have lower inflation in 2022 than in 2021, and still lower in 2023. (The exceptions are Britain, China, Japan, and Indonesia.)
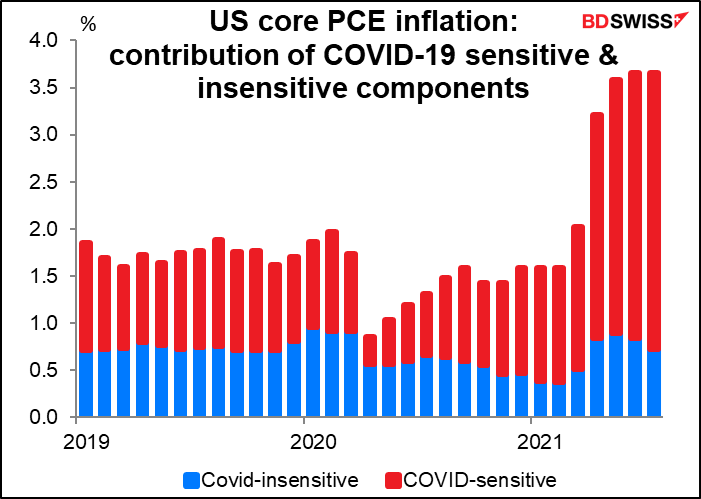
The US shows why this is so. The San Francisco Fed maintains data on “Inflation Sensitivity to COVID-19.” COVID-sensitive components include those categories where either prices or quantities moved in a statistically significant manner at the onset of the pandemic, between February and April 2020. COVID-insensitive components include all other core PCE categories. As the graph shows, the surge in prices now is due largely to the components that plunged in price when the pandemic started. Eventually, one assumes that these effects will work through the system, like a snake digesting a mouse.
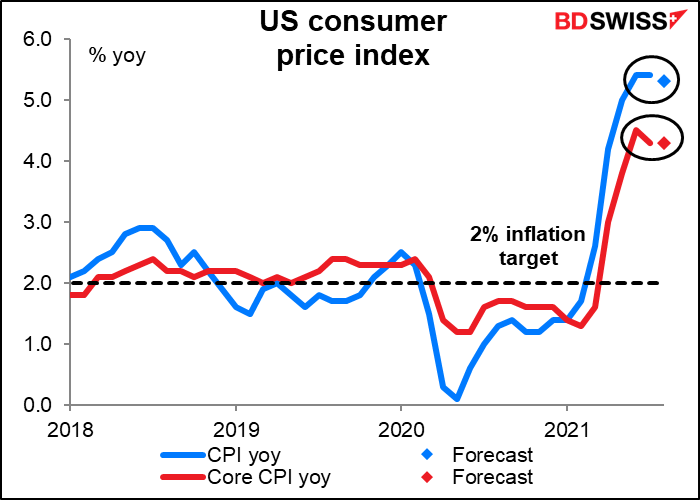
This month, the US inflation is expected to be little changed. Headline inflation is forecast to slow by a mere 0.10 percentage point, while the core inflation rate is forecast to be unchanged.
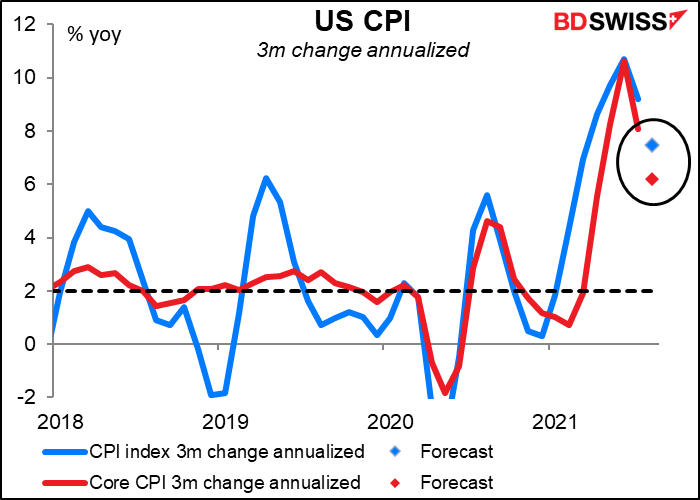
If we just take the short-term changes (over the last three months) and annualize them, then it does appear that the pace of inflation is slowing – although still quite high.
The fear in the US is that with the virus still out of control, with supplementary Federal unemployment benefits having expired, and with some 3.5mn people facing eviction in the next several months, the US could be heading toward the dreaded stagflation. That would force the Fed to choose between meeting its inflation mandate and its employment mandate. I expect that they would choose their employment mandate, at least for as long as they can get away with it. That would mean a weaker dollar.
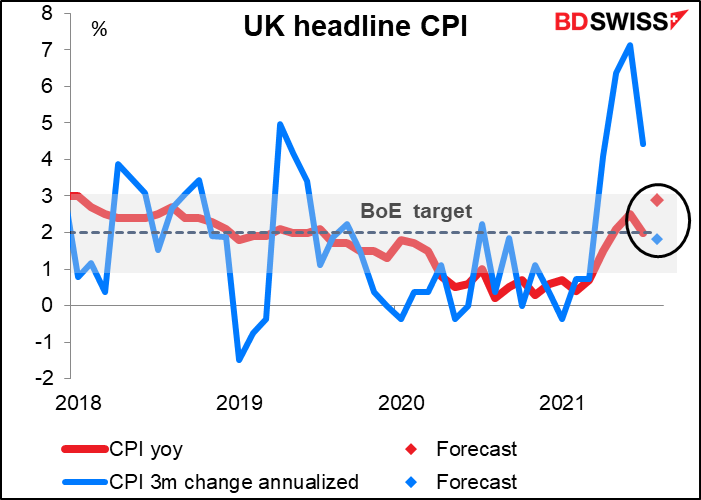
The UK headline rate of inflation is expected to rise precipitously: +0.9 percentage point in one month. However, that’s due in a large part to base effects, as prices rose by only +0.2% mom in August 2020. If we look here too at the three-month change in prices, on the contrary it’s expected to slow considerably and in fact is forecast to be a bit below the Bank of England’s 2% central target.
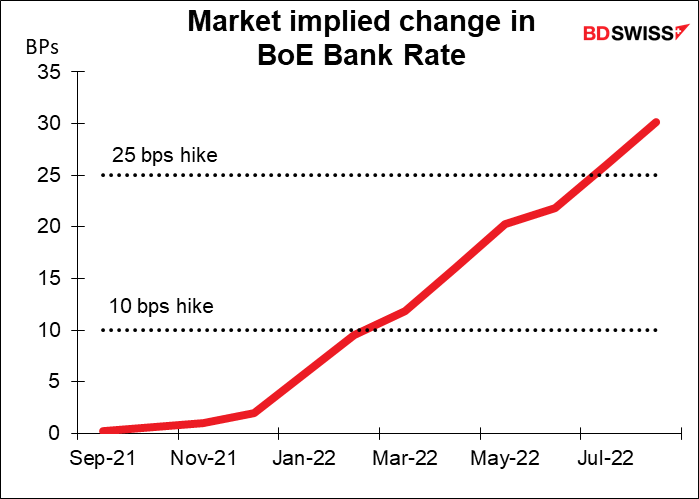
The question is, what will the market focus on? I think market participants are likely to see the leap in inflation and think “BoE tightening.” Never mind that the Bank said last month that “The Committee’s central expectation is that current elevated global and domestic cost pressures will prove transitory” and that “CPI inflation is projected to rise temporarily in the near term, to 4% in 2021 Q4, owing largely to developments in energy and other goods prices, before falling back to close to the 2% target.”
The market is expecting perhaps a 10 bps hike in rates by February or a full 25 bps rate hike by next July. Higher inflation could get some investors speculating about a steeper tightening path. That would be GBP-positive.
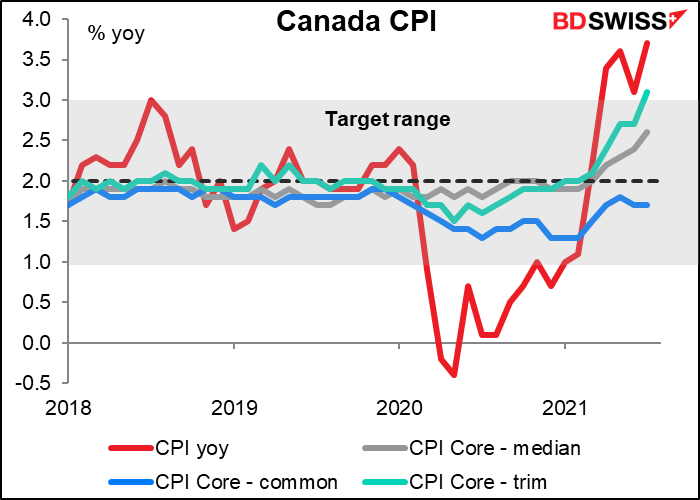
Forecasts are not yet available for the Canadian CPI. It’s already well above the target range, and even one of the core measures – CPI core-trim – is, too (3.1%).
The Bank of Canada this week said this was “as expected” due to “base-year effects, gasoline prices, and pandemic-related supply bottlenecks.” “These factors pushing up inflation are expected to be transitory, but their persistence and magnitude are uncertain and will be monitored closely,” they added. Indeed, those are the big questions: how long is “transitory” and how high is “above target”?
The other big US indicator out during the week is US retail sales on Thursday. Sales are expected to be down for the second month in a row (third month out of four).
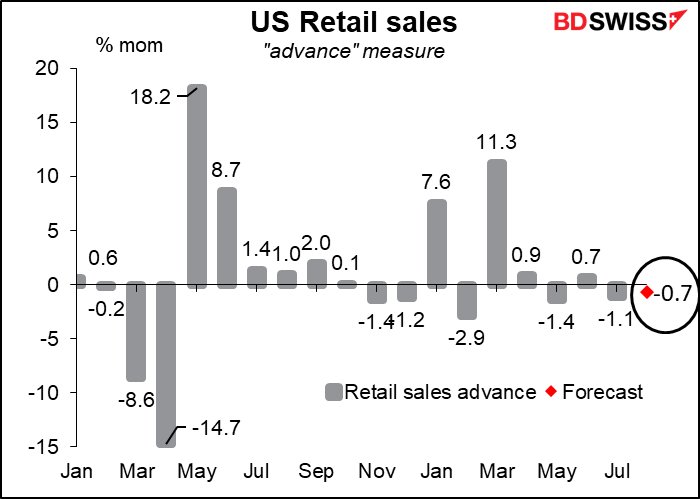
Autos account for much of the decline, but not all – sales are expected to be lower excluding autos, too.
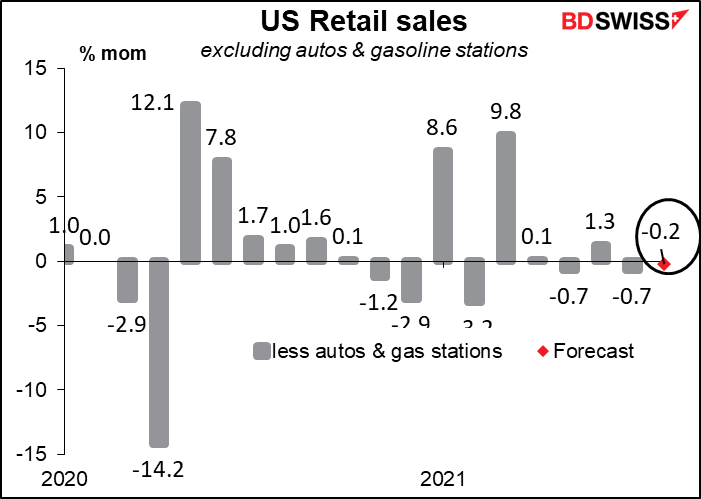
It shouldn’t be any surprise that sales are declining. The forecast drop will still leave sales some 16.5% above their pre-pandemic level.
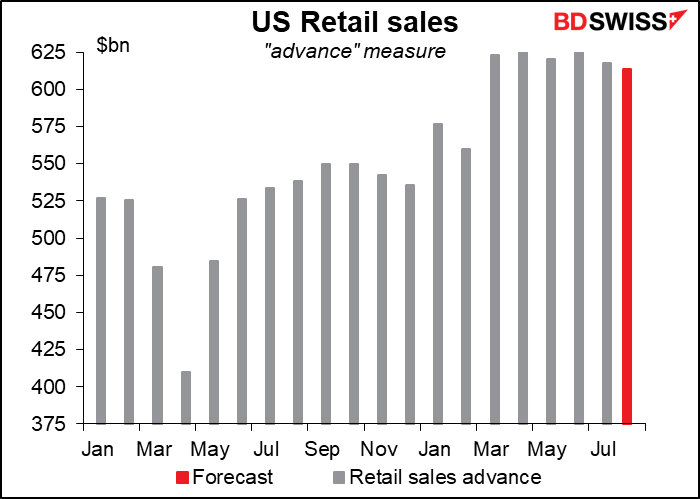
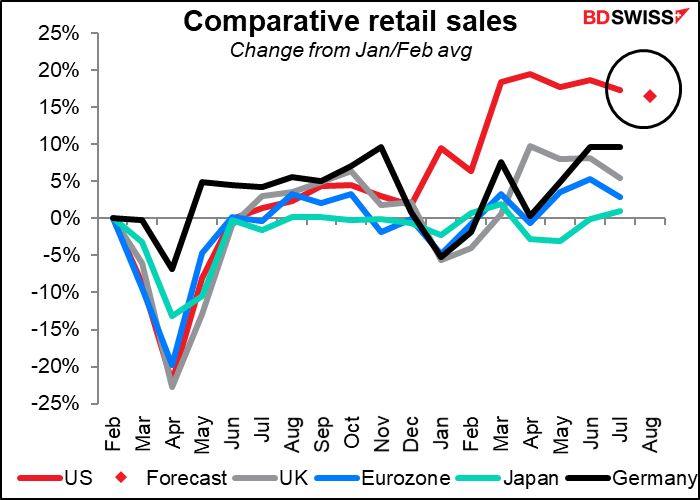
Retail sales in the US have been much stronger than in other major countries, thanks to the generous fiscal stimulus payments and expanded Federal unemployment benefits. I wouldn’t be surprised to see US retail sales falling for several more months as these extraordinary measures wind down. The question is what that’s likely to do to expectations for the US economy, which is 70% driven by consumption. It could be negative for USD even if it just represents a reversion to the norm.
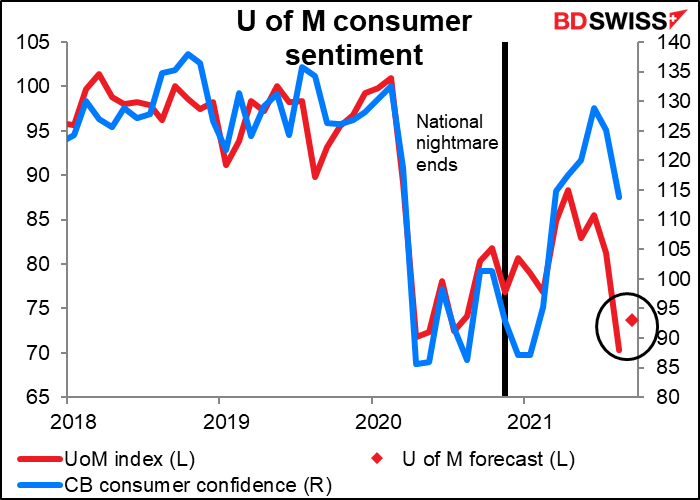
Speaking of retail sales, we also have the University of Michigan consumer sentiment index coming out on Friday. It plunged recently but is expected to claw back some of its losses. Still, sagging consumer confidence is not likely to inspire raging consumption.
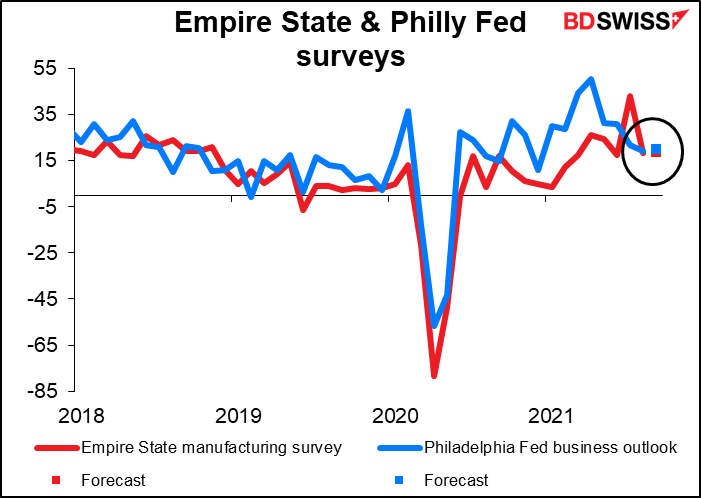
We’ll also get the Empire State manufacturing index on Tuesday and the Philadelphia Fed business sentiment index on Thursday. They’re both expected to be little changed at their current relatively robust levels. That could offset some of the pessimistic impact of another fall in retail sales.
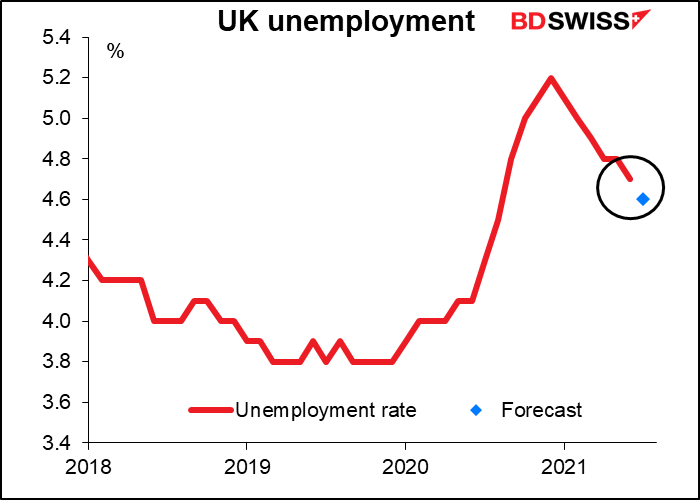
Elsewhere, the UK releases employment data on Tuesday and retail sales on Friday. The unemployment rate is expected to fall by 2 percentage points. Like in the US, the slow recovery in employment may be due to structural changes in the labor market. “There appear to have been difficulties in matching available jobs and workers,” the Bank of England said after its recent meeting. “These frictions are for a period reducing effective supply in the economy.”
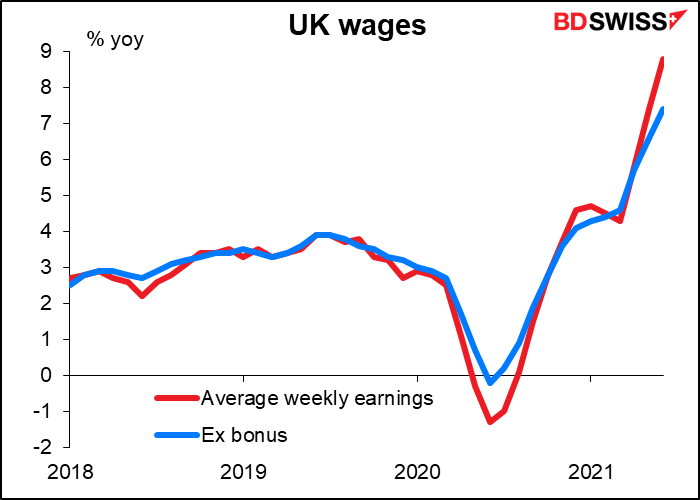
I think they will therefore place more importance on the average weekly earnings figure, which we don’t have a forecast for yet. UK wages are rising at a much faster pace than inflation, which could give rise to fears of a wage-price spiral – although ha quick Granger causality test shows that it’s inflation that (Granger) causes wages to go up, not wages that (Granger) cause inflation to rise.
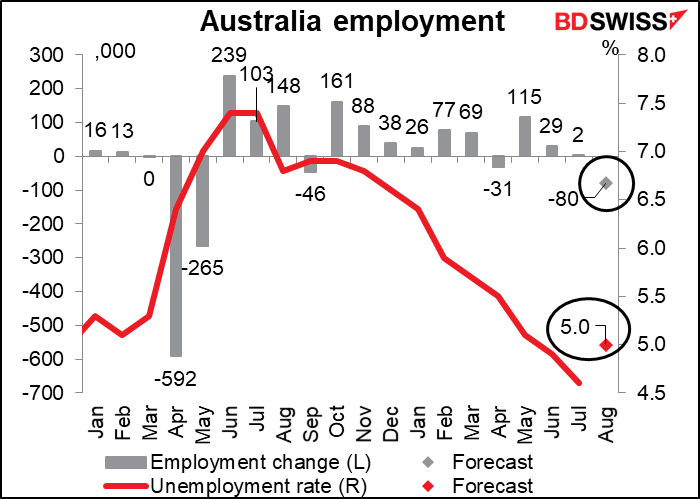
Australia announces its employment data on Thursday. This is important, because the Reserve Bank of Australia (RBA) this week once again said that it would ”continue to review the bond purchase program in light of economic conditions and the health situation, and their implications for the expected progress towards full employment and the inflation target.” The number of jobs is expected to fall while the unemployment rate is expected to rise. This could tempt them to make further adjustments to their bond purchase program as they did this week, with similar effect, i.e. weakening AUD.
Author

Marshall Gittler
Trading Analysis


