Indices Drop To End The Week Due To New Tariffs on Mexico or Technical?

President Donald Trump threatened on Thursday to impose new tariffs on Mexico if the country does not step up its immigration enforcement actions, combining his boiling border-related frustrations with his preferred method of punishing foreign countries.
Trump said in a White House statement that the first round of tariffs would begin on June 10 at 5% "on all goods imported from Mexico."
This resulted in a sell off in the World Indices starting in the Asian session on Friday. Was the drop really due to this announcement or was the market already technically positioned to drop and this news just acted a catalyst for the drop? Let's take a look at some charts below to see why we think the drop was purely technical and happened from the blue boxes presented on our charts to members.
ES_F 30 May 1 Hour Elliott Wave Chart (Before New Tariffs on Mexico announced)
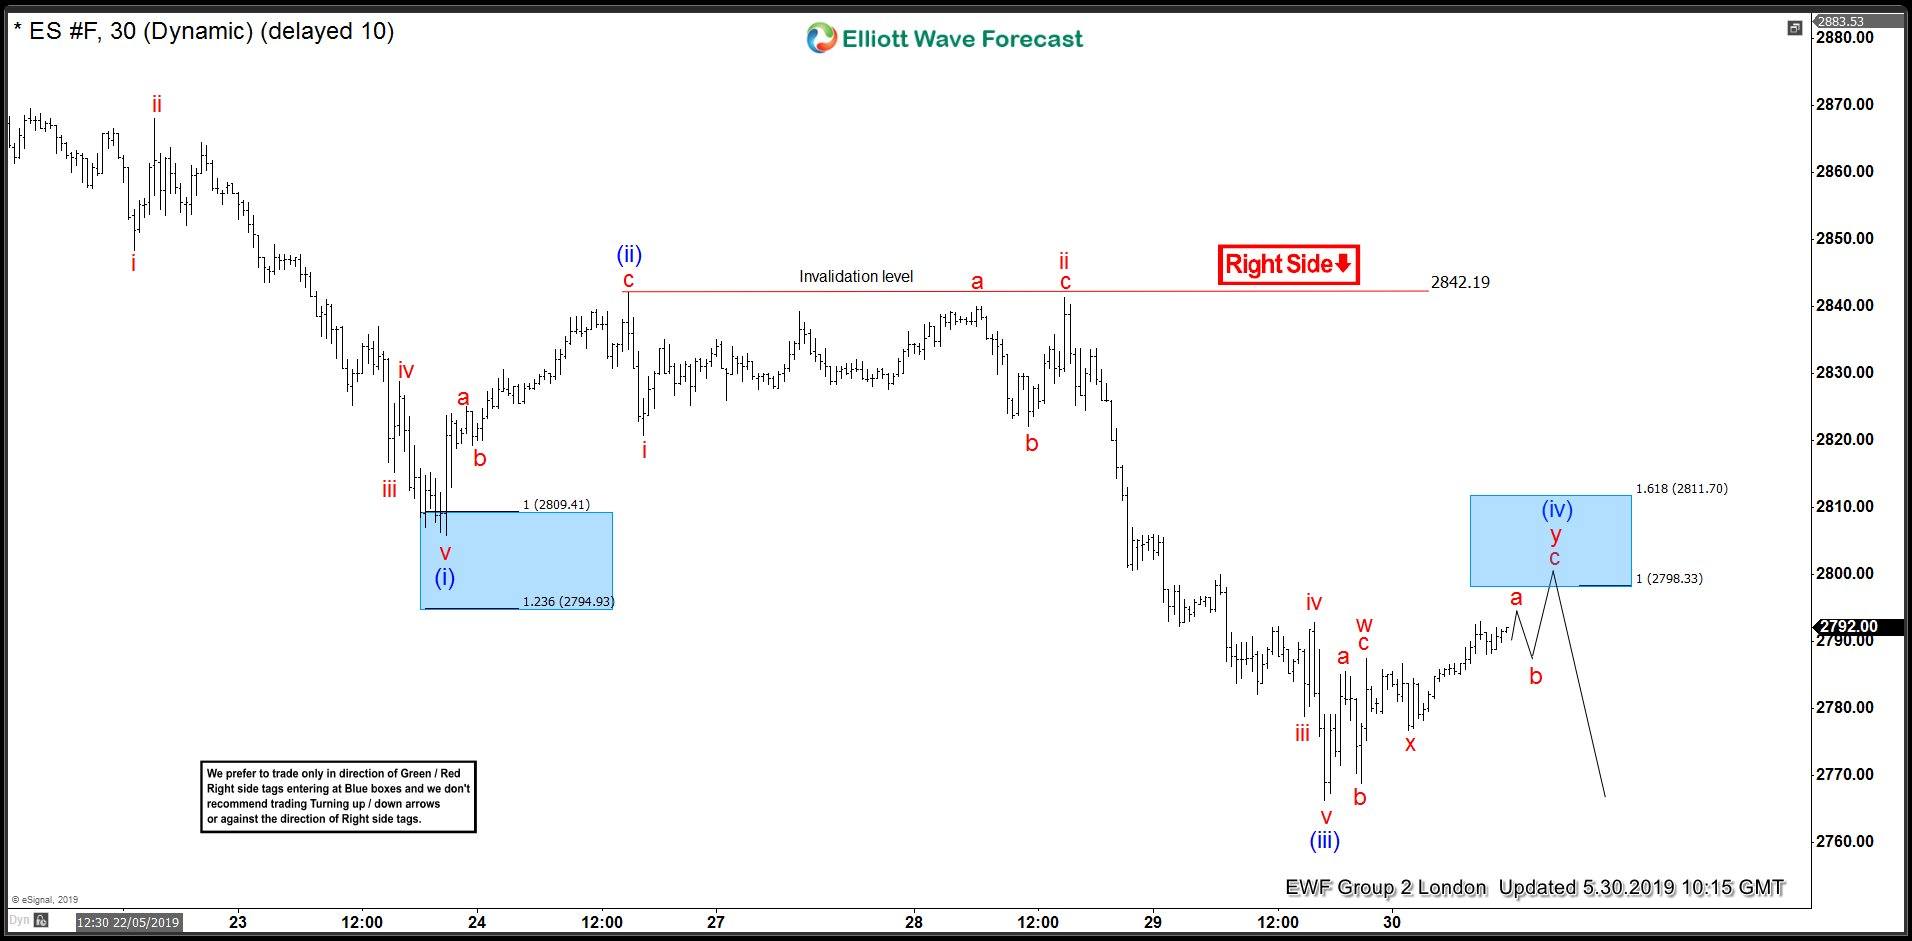
Chart below was published at 10:15 GMT on 30th May well before President Trump announced new 5% Tariff on Mexico, the chart showed the red Right side tag which suggested the right side was lower and decline was expected to resume after corrective bounce ended. Shaded blue box area showed the area for the corrective bounce to end and then decline to resume to new lows or a 3 waves reaction lower at least to take place from the blue box.
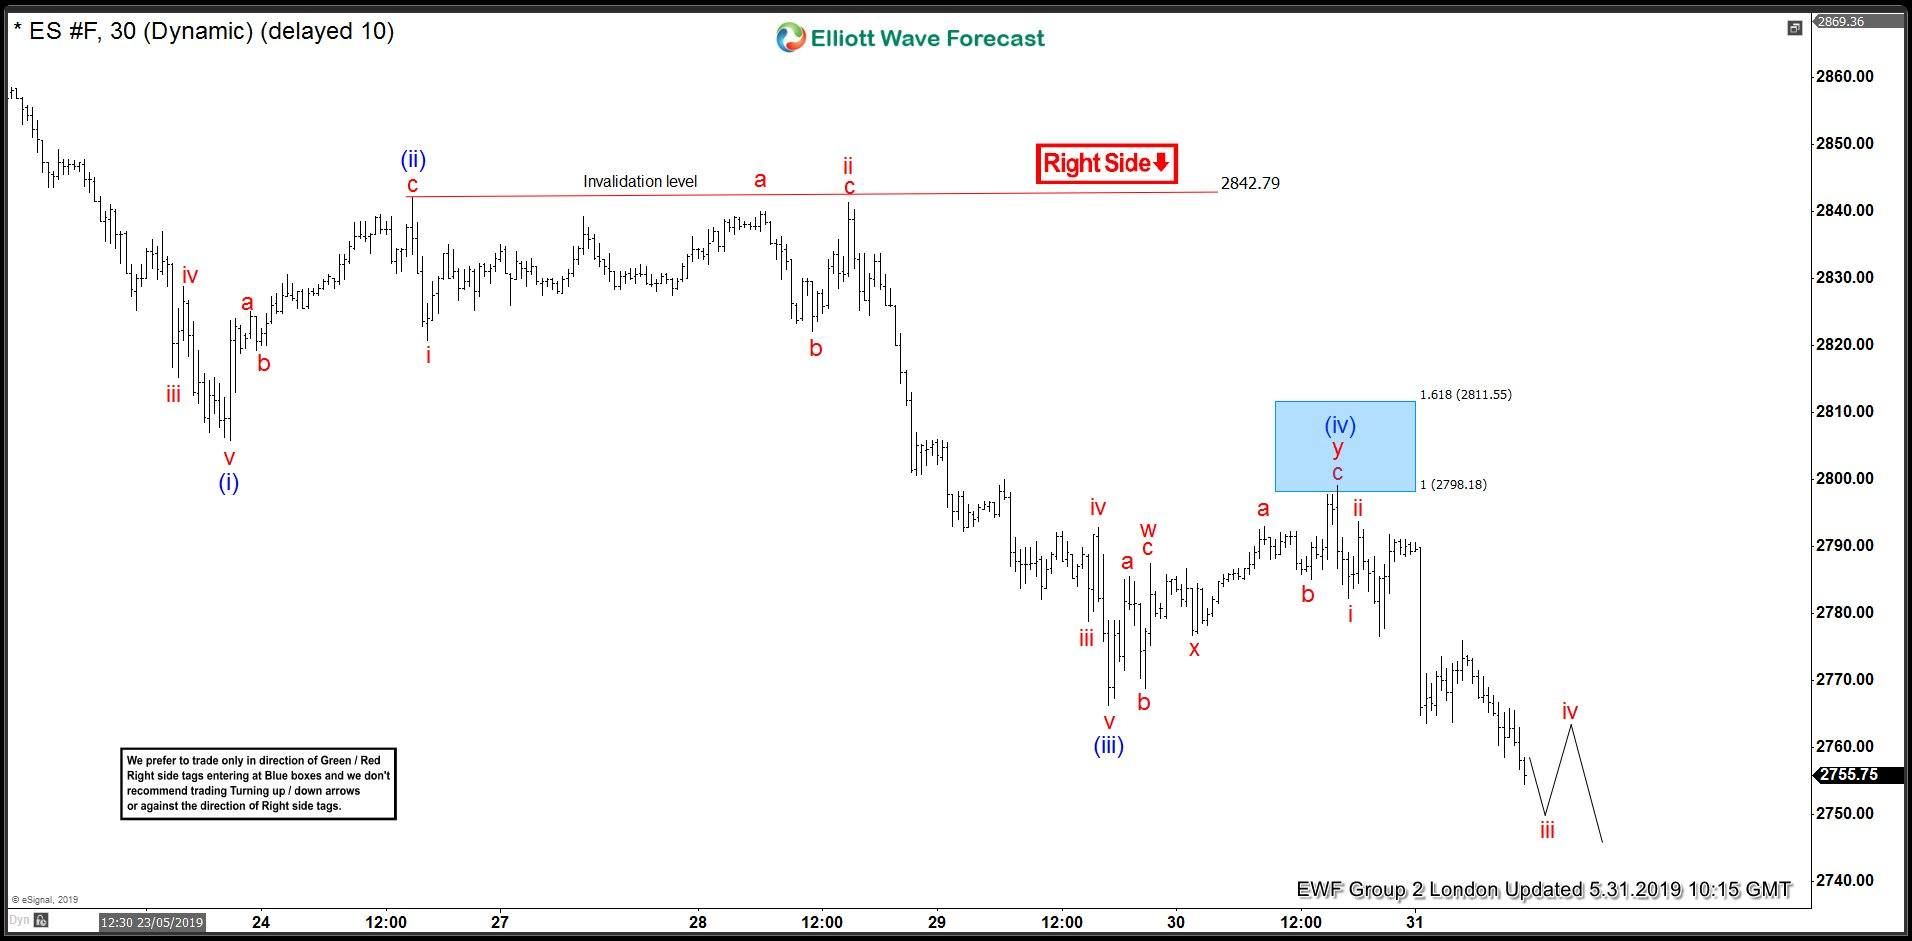
E-mini S&P 500 futures reached the blue box and reacted lower but didn't break the lows. Then, we got the news of new Tariffs on Mexico which acted as a catalyst for a new wave of selling to new lows. Let's take a look at the chart below
ES_F 31 May 1 Hour Elliott Wave Chart (After New Tariffs on Mexico announced)
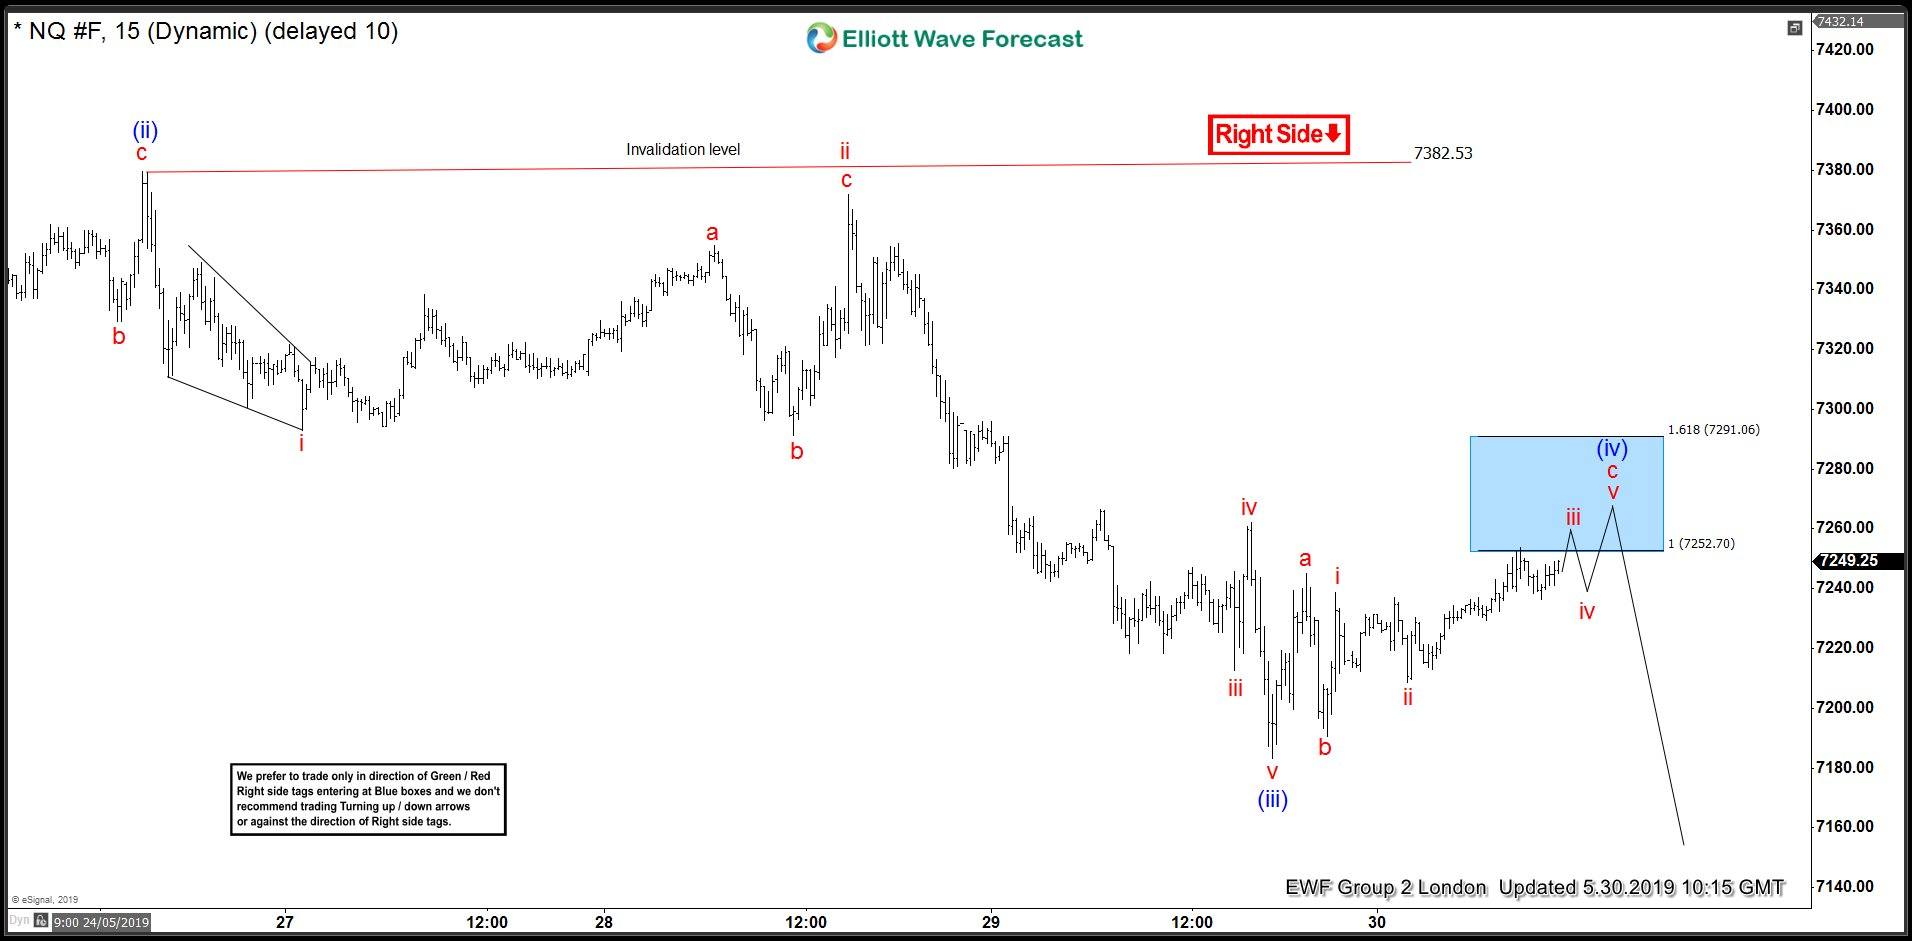
Nasdaq Futures 30 May 1 Hour Elliott Wave Chart (Before New Tariffs on Mexico announced)
Chart below was published at 10:15 GMT on 30th May well before President Trump announced new 5% Tariff on Mexico, the chart showed the red Right side tag which suggested the right side was lower and decline was expected to resume after corrective bounce ended. Shaded blue box area showed the area for the corrective bounce to end and then decline to resume to new lows or a 3 waves reaction lower at least to take place from the blue box.
Nasdaq Futures 30 May 1 Hour Elliott Wave Chart (After New Tariffs on Mexico announced)
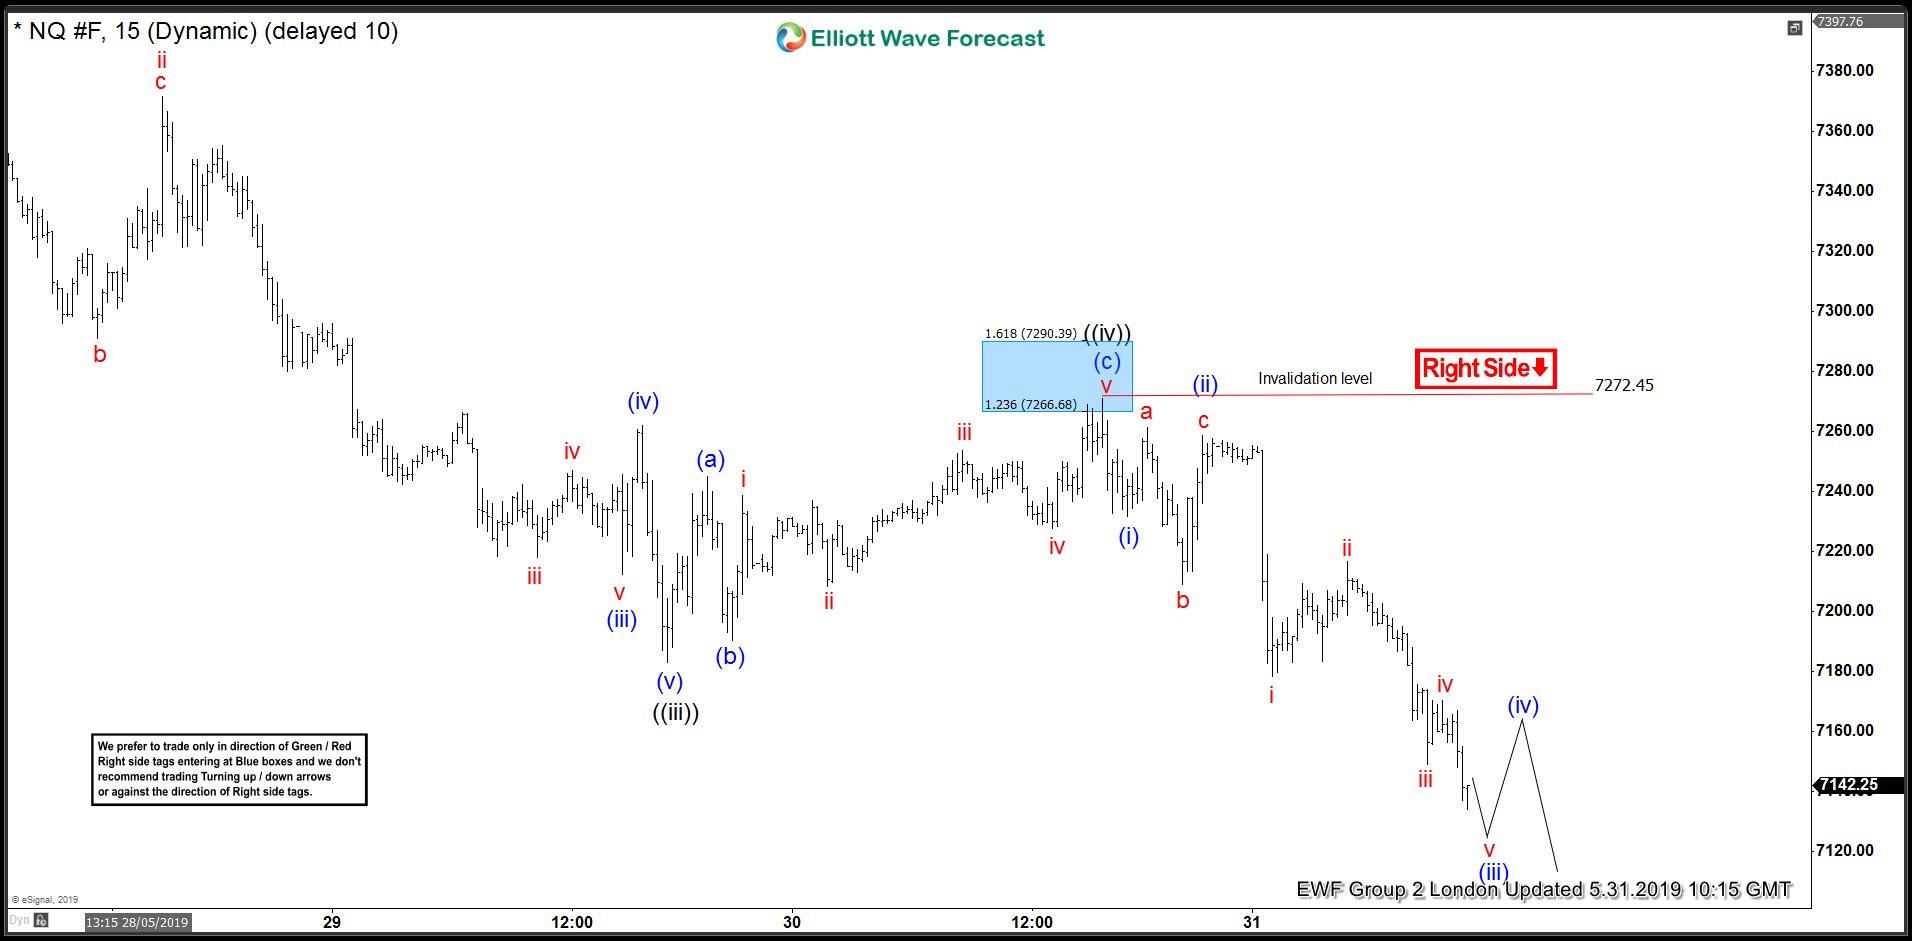
This is yet another proof that markets are very technical and news just acts as a catalyst. We always advise our members to cut the noise and follow the Technicals and we aim to provide an edge to our members through Right Side tags and blue box areas to help identify the right side of the market and entry / profit taking areas. Also, by not trading against the right side tags or trading the turning arrows, members can avoid being on the wrong side of the market.
Interested in active FX or CRYPTO Elliott Wave labeled charts on a daily basis? Now it's your time; we have a SPECIAL offer; 50% Off on FX and Crypto markets. Check Elliott Wave Forecast website for more details.
Author

Elliott Wave Forecast Team
ElliottWave-Forecast.com


