In 2021 the weakest month is still positive

August is often the worst month of the year for stocks, but it is 2021.
It seems investors can't get enough risk in 2021. Ironically, I doubt those all-in at all-time-highs are considering risk and the consequences of getting over their skis. That said, it has paid handsomely to be an aggressive bull behaving with all abandon. To be honest, I am a little jealous. I started tapering risk in my personal (long-term) investment portfolios early.
The inertia in stocks is stunning. While there are some signs of small cracks, we've seen the major indices plow through the doubt without as much as a 5% pullback. In March of 2020 we noted the markets were different than what they were 10 to 20 years ago due to algorithmic trading and immediate electronic access to markets by anyone with a cell phone or computer. In this environment, corrections are faster, harder, and bigger. But as we are learning in the aftermath of March 2020, they are also less frequent because computers and people are trained to buy dips and HODL.
Treasury Futures Markets
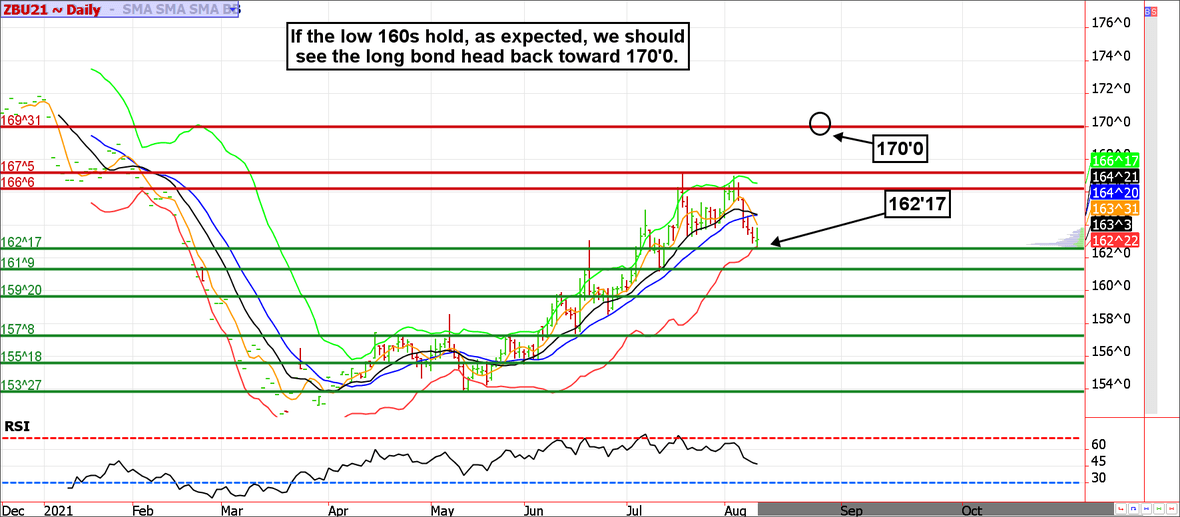
30-year Treasury Bond Futures
Treasuries had a good day despite the closing price.
Bond and note traders had an eventful day; it started out with the July CPI report and ended with an auction. The indirect bidders, assumed to be overseas buyers, were active at a yield of 1.34%. As we have repetitively mentioned, our trash (low-yielding Treasuries) is seen as a Treasure for those investors facing negative yields in some overseas markets.
We continue to believe the 10-year will see 1%; even further...we can't rule out a full retest of the 2020 low yield of 0.65%. The US economy is obviously doing better than it was as the 10-year was yielding less than 1% but that doesn't matter; market prices are the result of motivation by buyers and sellers. In our view, buyers will continue to be motivated as long as global central banks are collectively depressing rates.
Treasury futures market consensus:
We like being bulls on dips, but the dip could see 161'0 in the 30-year. If the low 160's hold, 170ish should be on tap.
Technical Support: ZB: 162'17, 161'09, 159'20, 157'08, 155'19, 153'27 and 151'11 ZN: 133'08, 132'26, 132'08, 131'19, 130'31 and 123'23
Technical Resistance: ZB: 166'06, 167'05, and 170'0 ZN: 134'13, 135'07 and 137'0
Stock Index Futures

Big breaks in oil are generally followed by big breaks in the stock market. However, the correlation lags significantly. In 2020, the oil market topped out a little over a month ahead of stocks; if we get something similar this time around, selling in equities should be due either this week or next.
A friend of ours, Carolyn Boroden, pointed out a simple but somewhat reliable pattern. Rallies in the S&P tend to extend for 20 to 24 weeks before taking a breather (we are on week 24). Sometimes that correction is minimal, but sometimes it can be quite substantial. This is obviously a loose theory and shouldn't be blindly followed but it is worth being aware of. In essence, if the bears are going to get anything done, it will need to be in the coming week or so.
Stock index futures market consensus:
The market isn't melting through resistance, but it isn't rolling over either. The bears will need a reversal near 4450ish.
Technical Support: 4364, 4285, 4164, 4070, 3990
Technical Resistance: 4445 and 4462
E-mini S&P Futures Day Trading Levels
These are counter-trend entry ideas, the more distant the level the more reliable but the less likely to get filled
ES Day Trade Sell Levels: 4445 and 4456
ES Day Trade Buy Levels: 4367, 4343, 4304, 4250, and 4220
In other commodity futures and options markets...
June 18 - Buy the September soybean 13.20 call, sell the 14.20 call and the 15.20 call (ladder).
June 21 - September wheat ladders (buy the 6.75 call, sell the 7.25 call and the 7.60 call to finance the long 6.75.
June 23 - September crude oil butterflies, buy the September 70 put, sell 2 65 puts, and buy the 60 put.
June 30 - December corn bullish call ladders using the 5.50/6.50/7.00 strikes (low-cost trade with little downside risk).
July 7 - Buy 1 September 30-year 164 call, sell 1 167 call, and sell a 170 call for a net cost of 32 ticks.
July 16 - Buy 1 December gold 1850 call, sell 1 December gold 1950 call, and sell a December 2000 call to finance the trade.
July 22 - Buy October hog 90 put, sell 85 put and sell the 100 call.
July 26 - Buy November soybean 13.70 call, sell 14.70 call and sell the 15.70 call for a net of 14 cents.
August 5 - Buy December crude oil 70 call and sell the 75 and 80 call to create a call ladder. The total cost is about 70 cents or $700. The risk is unlimited above $85, profit potential is about $4,300.
August 10 - Buy December gold 1775 call, sell the 1850 call and the 1625 put for a "free" trade.
August 10 - Buy December crude oil 65 put, sell the 60 put and the 55 put to pay for it.
Due to time constraints and our fiduciary duty to put clients first, the charts provided in this newsletter may not reflect the current session data.
Seasonality is already factored into current prices, any references to such does not indicate future market action.
There is substantial risk of loss in trading futures and options.
These recommendations are a solicitation for entering into derivatives transactions. All known news and events have already been factored into the price of the underlying derivatives discussed. From time to time persons affiliated with Zaner, or its associated companies, may have positions in recommended and other derivatives. Past performance is not indicative of future results. The information and data in this report were obtained from sources considered reliable. Their accuracy or completeness is not guaranteed. Any decision to purchase or sell as a result of the opinions expressed in this report will be the full responsibility of the person authorizing such transaction. Seasonal tendencies are a composite of some of the more consistent commodity futures seasonals that have occurred over the past 15 or more years. There are usually underlying, fundamental circumstances that occur annually that tend to cause the futures markets to react in similar directional manner during a certain calendar year. While seasonal trends may potentially impact supply and demand in certain commodities, seasonal aspects of supply and demand have been factored into futures & options market pricing. Even if a seasonal tendency occurs in the future, it may not result in a profitable transaction as fees and the timing of the entry and liquidation may impact on the results. No representation is being made that any account has in the past, or will in the future, achieve profits using these recommendations. No representation is being made that price patterns will recur in the future.
It seems investors can't get enough risk in 2021. Ironically, I doubt those all-in at all-time-highs are considering risk and the consequences of getting over their skis. That said, it has paid handsomely to be an aggressive bull behaving with all abandon. To be honest, I am a little jealous. I started tapering risk in my personal (long-term) investment portfolios early.
The inertia in stocks is stunning. While there are some signs of small cracks, we've seen the major indices plow through the doubt without as much as a 5% pullback. In March of 2020 we noted the markets were different than what they were 10 to 20 years ago due to algorithmic trading and immediate electronic access to markets by anyone with a cell phone or computer. In this environment, corrections are faster, harder, and bigger. But as we are learning in the aftermath of March 2020, they are also less frequent because computers and people are trained to buy dips and HODL.
Treasury Futures Markets
30-year Treasury Bond Futures
Treasuries had a good day despite the closing price.
Bond and note traders had an eventful day; it started out with the July CPI report and ended with an auction. The indirect bidders, assumed to be overseas buyers, were active at a yield of 1.34%. As we have repetitively mentioned, our trash (low-yielding Treasuries) is seen as a Treasure for those investors facing negative yields in some overseas markets.
We continue to believe the 10-year will see 1%; even further...we can't rule out a full retest of the 2020 low yield of 0.65%. The US economy is obviously doing better than it was as the 10-year was yielding less than 1% but that doesn't matter; market prices are the result of motivation by buyers and sellers. In our view, buyers will continue to be motivated as long as global central banks are collectively depressing rates.
Treasury futures market consensus:
We like being bulls on dips, but the dip could see 161'0 in the 30-year. If the low 160's hold, 170ish should be on tap.
Technical Support: ZB: 162'17, 161'09, 159'20, 157'08, 155'19, 153'27 and 151'11 ZN: 133'08, 132'26, 132'08, 131'19, 130'31 and 123'23
Technical Resistance: ZB: 166'06, 167'05, and 170'0 ZN: 134'13, 135'07 and 137'0
Stock Index Futures
Big breaks in oil are generally followed by big breaks in the stock market. However, the correlation lags significantly. In 2020, the oil market topped out a little over a month ahead of stocks; if we get something similar this time around, selling in equities should be due either this week or next.
A friend of ours, Carolyn Boroden, pointed out a simple but somewhat reliable pattern. Rallies in the S&P tend to extend for 20 to 24 weeks before taking a breather (we are on week 24). Sometimes that correction is minimal, but sometimes it can be quite substantial. This is obviously a loose theory and shouldn't be blindly followed but it is worth being aware of. In essence, if the bears are going to get anything done, it will need to be in the coming week or so.
Stock index futures market consensus:
The market isn't melting through resistance, but it isn't rolling over either. The bears will need a reversal near 4450ish.
Technical Support: 4364, 4285, 4164, 4070, 3990
Technical Resistance: 4445 and 4462
E-mini S&P Futures Day Trading Levels
These are counter-trend entry ideas, the more distant the level the more reliable but the less likely to get filled
ES Day Trade Sell Levels: 4445 and 4456
ES Day Trade Buy Levels: 4367, 4343, 4304, 4250, and 4220
In other commodity futures and options markets...
June 18 - Buy the September soybean 13.20 call, sell the 14.20 call and the 15.20 call (ladder).
June 21 - September wheat ladders (buy the 6.75 call, sell the 7.25 call and the 7.60 call to finance the long 6.75.
June 23 - September crude oil butterflies, buy the September 70 put, sell 2 65 puts, and buy the 60 put.
June 30 - December corn bullish call ladders using the 5.50/6.50/7.00 strikes (low-cost trade with little downside risk).
July 7 - Buy 1 September 30-year 164 call, sell 1 167 call, and sell a 170 call for a net cost of 32 ticks.
July 16 - Buy 1 December gold 1850 call, sell 1 December gold 1950 call, and sell a December 2000 call to finance the trade.
July 22 - Buy October hog 90 put, sell 85 put and sell the 100 call.
July 26 - Buy November soybean 13.70 call, sell 14.70 call and sell the 15.70 call for a net of 14 cents.
August 5 - Buy December crude oil 70 call and sell the 75 and 80 call to create a call ladder. The total cost is about 70 cents or $700. The risk is unlimited above $85, profit potential is about $4,300.
August 10 - Buy December gold 1775 call, sell the 1850 call and the 1625 put for a "free" trade.
August 10 - Buy December crude oil 65 put, sell the 60 put and the 55 put to pay for it.
Due to time constraints and our fiduciary duty to put clients first, the charts provided in this newsletter may not reflect the current session data.
Seasonality is already factored into current prices, any references to such does not indicate future market action.
There is substantial risk of loss in trading futures and options.
These recommendations are a solicitation for entering into derivatives transactions. All known news and events have already been factored into the price of the underlying derivatives discussed. From time to time persons affiliated with Zaner, or its associated companies, may have positions in recommended and other derivatives. Past performance is not indicative of future results. The information and data in this report were obtained from sources considered reliable. Their accuracy or completeness is not guaranteed. Any decision to purchase or sell as a result of the opinions expressed in this report will be the full responsibility of the person authorizing such transaction. Seasonal tendencies are a composite of some of the more consistent commodity futures seasonals that have occurred over the past 15 or more years. There are usually underlying, fundamental circumstances that occur annually that tend to cause the futures markets to react in similar directional manner during a certain calendar year. While seasonal trends may potentially impact supply and demand in certain commodities, seasonal aspects of supply and demand have been factored into futures & options market pricing. Even if a seasonal tendency occurs in the future, it may not result in a profitable transaction as fees and the timing of the entry and liquidation may impact on the results. No representation is being made that any account has in the past, or will in the future, achieve profits using these recommendations. No representation is being made that price patterns will recur in the future.
Author

Carley Garner
DeCarley Trading
Carley Garner is an experienced commodity broker with DeCarley Trading, a division of Zaner, in Las Vegas, Nevada. She is also the author of multiple books including, “Higher Probability Commodity Trading” and “A Trader's First Book on Commodities”.
More from Carley Garner


