If USD/JPY breaks 112.42, there is lot of room to run higher – Confluence Detector


The USD/JPY climbed higher on US Dollar strength and reached the highest levels since January. What's next? 

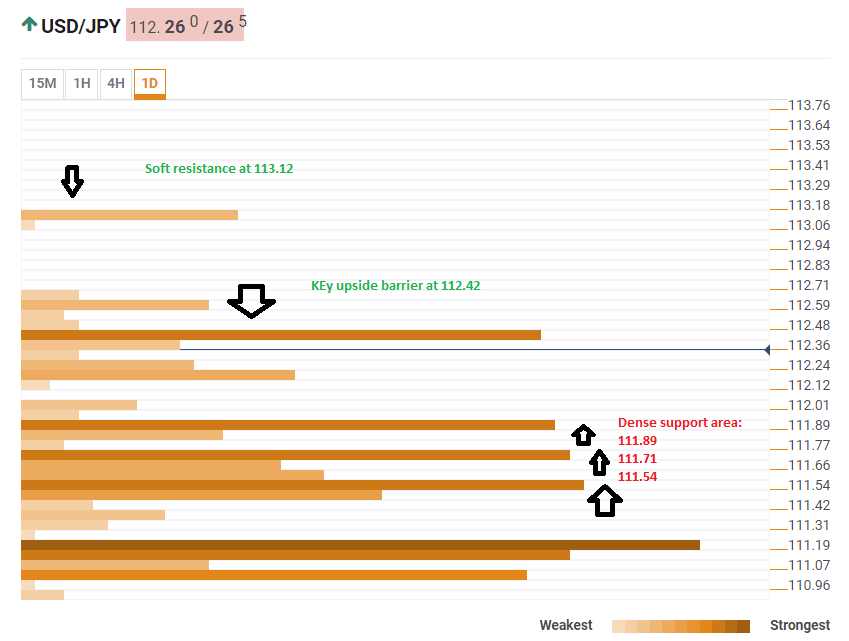
The Technical Confluences Indicator shows that the pair faces a cluster of resistance levels at 112.42. This is the convergence of the Bolinger band 15m-Upper, the Pivot Point one-month Resistance 2, the 4-h high, and more. 

Above this level, 113.12 is worth mentioning, but we only see the Pivot Point one-day Resistance 2 resistance line there, not a heavy-weight. 

Looking down, the pair has a lot of support. 111.89 is the confluence of the Bolinger Band one-hour Middle, the Fibonacci 23.6% one-day, and the Pivot Point one-week Resistance. It is closely followed by 111.71 which is the meeting point of the Simple Moving Average 100-15m and the Fibonacci 161.8% one-week. It is closely followed by 111.54 which is the potent Pivot Point one-week Resistance 2.

All in all, the USD/JPY has a lot of support and only a few resistance lines.

Here is how it looks on the tool:

USD JPY confluence technical levels July 12 2018

Confluence Detector

The Confluence Detector finds exciting opportunities using Technical Confluences. The TC is a tool to locate and point out those price levels where there is a congestion of indicators, moving averages, Fibonacci levels, Pivot Points, etc. Knowing where these congestion points are located is very useful for the trader, and can be used as a basis for different strategies.

This tool assigns a certain amount of “weight” to each indicator, and this “weight” can influence adjacents price levels. These weightings mean that one price level without any indicator or moving average but under the influence of two “strongly weighted” levels accumulate more resistance than their neighbors. In these cases, the tool signals resistance in apparently empty areas.

Learn more about Technical Confluence

Information on these pages contains forward-looking statements that involve risks and uncertainties. Markets and instruments profiled on this page are for informational purposes only and should not in any way come across as a recommendation to buy or sell in these assets. You should do your own thorough research before making any investment decisions. FXStreet does not in any way guarantee that this information is free from mistakes, errors, or material misstatements. It also does not guarantee that this information is of a timely nature. Investing in Open Markets involves a great deal of risk, including the loss of all or a portion of your investment, as well as emotional distress. All risks, losses and costs associated with investing, including total loss of principal, are your responsibility. The views and opinions expressed in this article are those of the authors and do not necessarily reflect the official policy or position of FXStreet nor its advertisers. The author will not be held responsible for information that is found at the end of links posted on this page.

If not otherwise explicitly mentioned in the body of the article, at the time of writing, the author has no position in any stock mentioned in this article and no business relationship with any company mentioned. The author has not received compensation for writing this article, other than from FXStreet.

FXStreet and the author do not provide personalized recommendations. The author makes no representations as to the accuracy, completeness, or suitability of this information. FXStreet and the author will not be liable for any errors, omissions or any losses, injuries or damages arising from this information and its display or use. Errors and omissions excepted.

The author and FXStreet are not registered investment advisors and nothing in this article is intended to be investment advice.

Recommended Content


Recommended Content

Editors’ Picks

US economy grows at an annual rate of 1.6% in Q1 – LIVE

US economy grows at an annual rate of 1.6% in Q1 – LIVE

The US' real GDP expanded at an annual rate of 1.6% in the first quarter, the US Bureau of Economic Analysis' first estimate showed on Thursday. This reading came in worse than the market expectation for a growth of 2.5%.

FOLLOW US LIVE

EUR/USD retreats to 1.0700 after US GDP data

EUR/USD retreats to 1.0700 after US GDP data

EUR/USD came under modest bearish pressure and retreated to the 1.0700 area. Although the US data showed that the economy grew at a softer pace than expected in Q1, strong inflation-related details provided a boost to the USD.

EUR/USD News

GBP/USD declines below 1.2500 with first reaction to US data

GBP/USD declines below 1.2500 with first reaction to US data

GBP/USD declined below 1.2500 and erased a portion of its daily gains with the immediate reaction to the US GDP report. The US economy expanded at a softer pace than expected in Q1 but the price deflator jumped to 3.4% from 1.8%. 

GBP/USD News

Gold price edges higher amid weaker USD and softer risk tone, focus remains on US GDP

Gold price edges higher amid weaker USD and softer risk tone, focus remains on US GDP

Gold price (XAU/USD) attracts some dip-buying in the vicinity of the $2,300 mark on Thursday and for now, seems to have snapped a three-day losing streak, though the upside potential seems limited. 

Gold News

XRP extends its decline, crypto experts comment on Ripple stablecoin and benefits for XRP Ledger

XRP extends its decline, crypto experts comment on Ripple stablecoin and benefits for XRP Ledger

Ripple extends decline to $0.52 on Thursday, wipes out weekly gains. Crypto expert asks Ripple CTO how the stablecoin will benefit the XRP Ledger and native token XRP. 

Read more

Majors

Cryptocurrencies

Signatures