If Rates Go Up, Will Bonds Go Down?

The whole concept that bond prices go down when rates go up is somewhat of a myth. Sure, all else being equal, if the rates on a bond goes up, then the price of that bond will go down. However, this does not mean that bond prices as a whole will go down because the Federal Reserve is increasing interest rates. Broad bond market price movements are a response to far more variables than just the Fed funds rate.
In fact, often times when the Federal Reserve raises rates the yield curve, or the difference between short term interest rates and long-term interest rates, flattens. This means that long-term rates stay rather stable, or in some cases decline, while short-term rates are increasing. This year, we have witnessed a flattening of the yield curve that unfortunately has become the focus of market pundits. Historically, flattening yield curves are not bad for the stock market. In fact, market returns can be good during the time period when the yield curve is flattening.
ON THE OHER HAND...
There comes a time when the yield curve inverts. This means that short-term rates are higher than longterm rates. This is a historical precursor to a recession, but usually predates the eventual economic decline by 12 to 18 months. So even if the yield curve goes negative, typically the economy has a little room to run. Despite its historical accuracy, it is not the holy grail of investing. It does suggest that the credit conditions are tightening. Other signs such as credit spreads widening and a pervasive decline in economic output, in conjunction with an inverted curve, could mean danger for the global economy and risky assets.
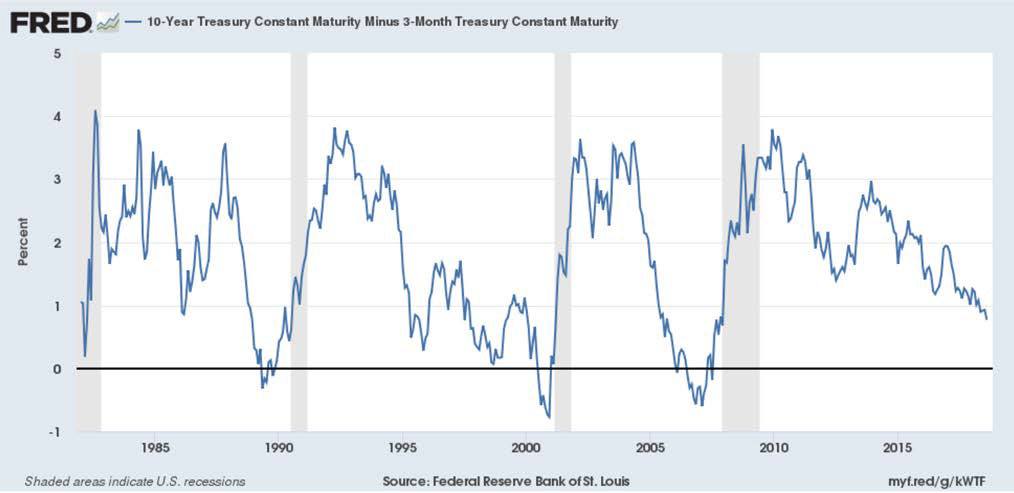
The yield curve is not yet inverted, meaning that the stock market and economy may have more room to run. We should start to become worried when either the yield curve inverts, or more importantly, when there are other signs of economic decline or market weakness.
So should someone avoid bonds because of the Fed raising rates?
In our opinion it is more complicated than that. First off, duration matters and since the Fed controls the short end of the curve, allocating more to intermediate or long-term bonds could be beneficial upon the eventual inversion. It is probably almost heresy to hear someone saying that long-term bonds are likely not a bad buy here. But let's look at some supporting evidence....
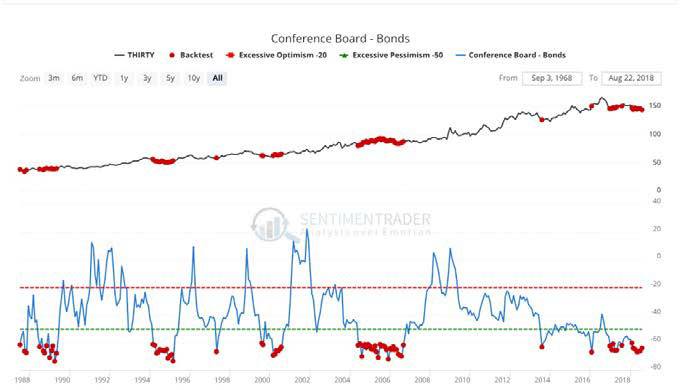
With the help of Sentimenttrader.com we were able to look at long-term sentiment in bonds via the conference board indicators for bonds. The description of the indicator is as referenced below:
"This shows the net percentage of consumers expecting bond prices to increase minus decrease, according to a monthly survey from the Conference Board. If the figure is high, then it means a large number of consumers expect bond prices to rise (interest rates to fall). Because it is a contrary indicator, this would be bearish for bond prices (bullish for interest rates). Conversely, if the indicator is low, then consumers expect bonds to decline (interest rates to rise), which would be bullish for bonds (bearish for interest rates)." This is provided for informational purposes only and should not be considered a recommendation to buy or sell a particular security. Past performance is no guarantee of future returns. Please see attached disclosures.
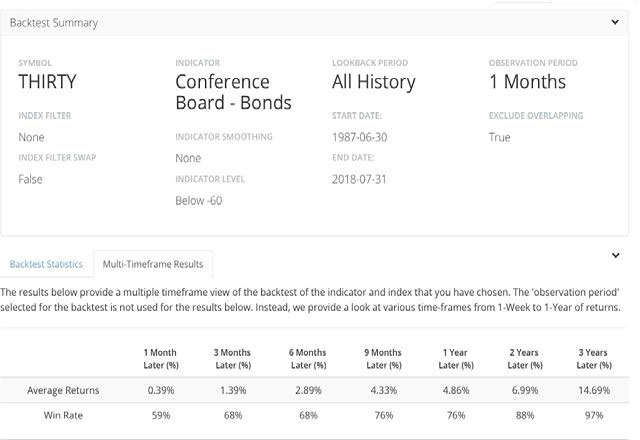
The chart to the right references the conference board indicator for bonds going back to 1987. We highlight via the red dots the instances when the indicator was extremely pessimistic, below -60. We then ran a simple back test to see what happens to long-term bonds after these instances.
The interesting data points are that over the next three years, after the indicator gets this pessimistic on bonds, the thirty year Treasury averaged over 14 percent for the next three years and had a 97 percent hit rate. What is also interesting is that there were good returns for longbonds over multiple time periods after the indicator suggested extreme pessimism for bonds. There is a very important caveat to consider here though: bonds were on a thirty year bull market that began in the early 1980's, so getting strong three year returns was not a hard task historically.
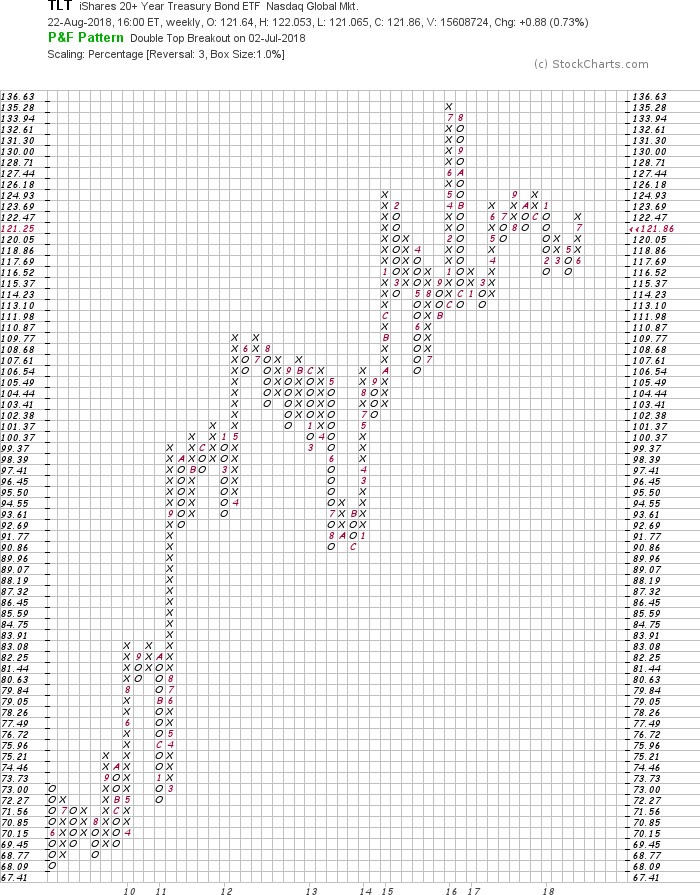
With the pessimistic backdrop around bonds, especially Treasuries, we should examine the ultimate indicator: price. In the chart below we see TLT, the Ishares ETF that tracks long-term Treasury bonds. It is currently on a point and figure buy signal and in a positive trend. The next buy signal comes on a break above 126.18 according to the weekly point and figure chart. This would clear substantial resistance and could result in further upside. Especially when everyone (sentiment wise) seems to be on one side of the boat.
Ultimately, it is bad advice to follow the wisdom of crowds at turning points. Everyone seems to think bonds have to go down here because the Fed is raising rates. It might warrant challenging that notion.
Author

Clint Sorenson, CFA, CMT
WealthShield


