If Bitcoin breaks below most recent low a deeper correction becomes likely

Summary
- Bitcoin forms potential Head and Shoulders Top at resistance of Fibonacci confluence
- Breakdown likely leads to a -29% or greater correction
Bitcoin (BTC/USD) topped out at $4,979.90 last week before moving into a retracement that has so far seen a decline of as much as -19.6%, as of last week’s $4,001.93 low. That percentage decline approximately matches the previous two retracements, which were -19.6% and -18.3% respectively. This likely means that if Bitcoin falls below $4,001.93 support with conviction it is heading lower.
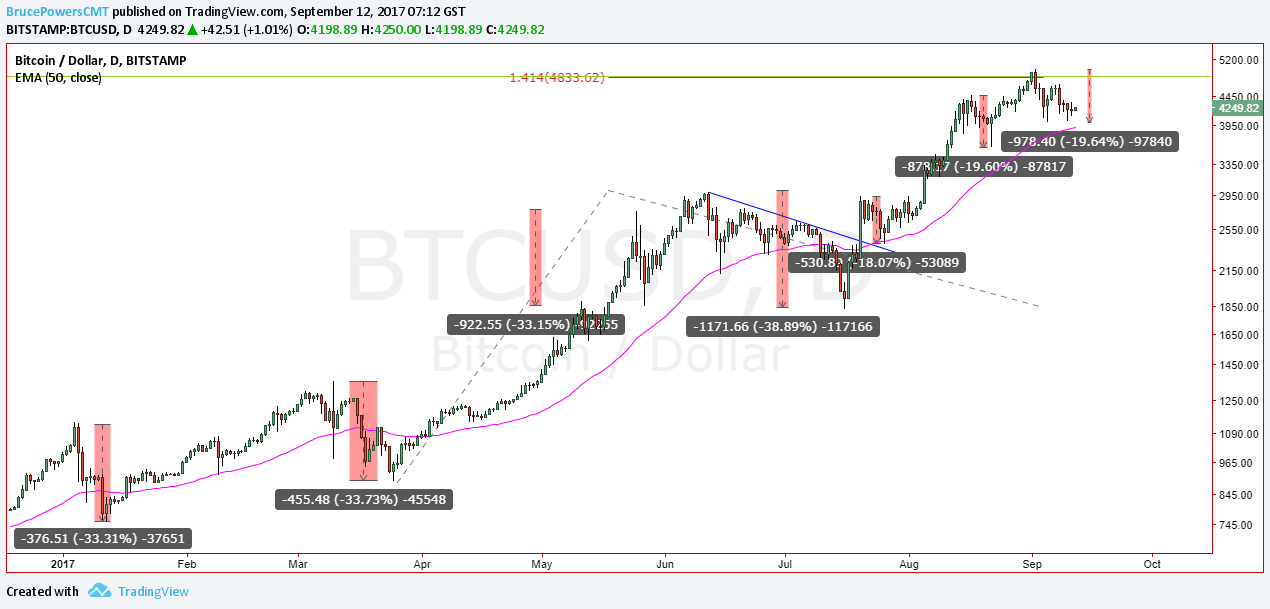
Prior Retracements
We can see on the enclosed chart that each of the four corrections occurring from January to mid-July were approximately -29% to -38%. Therefore, if last week’s low is exceeded to the downside a minimum decline of -29% can be anticipated and up to at least -38%. That would put the targets for Bitcoin, following a breakdown at approximately $3,535 to $3,080. The lower price target completes a 61.8% Fibonacci retracement of the uptrend begun from the July swing low.
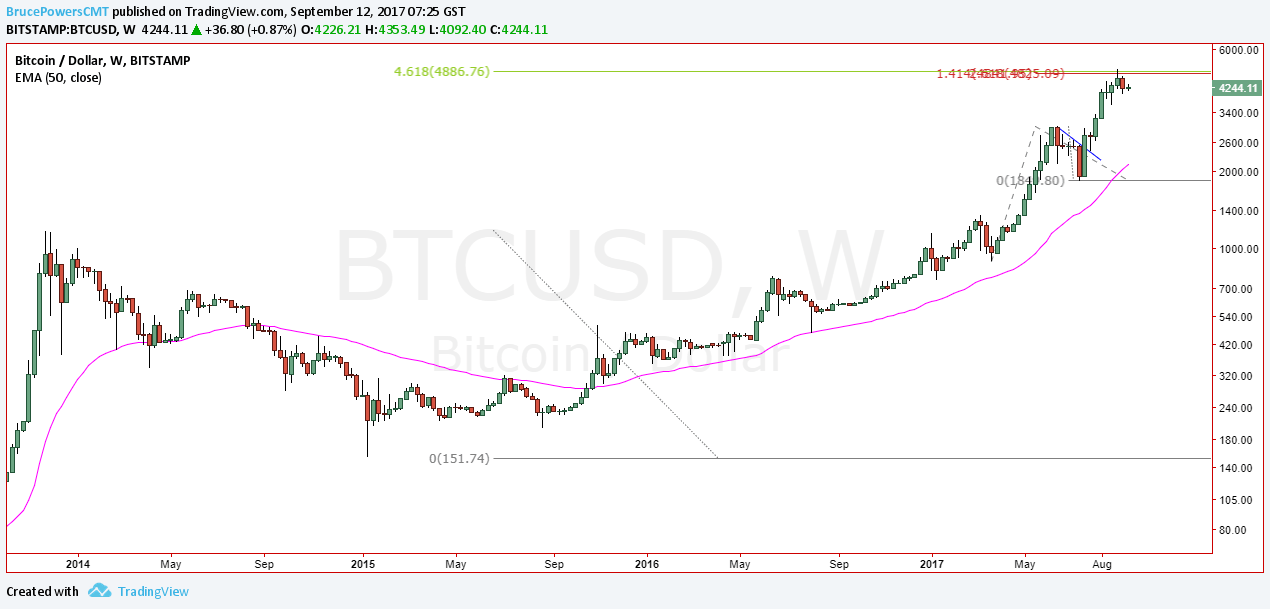
Is there any supporting evidence to suggest that the $4,979.90 peak may stop the ascent for now? It turns out there is some evidence. Last week’s high is in a resistance zone of three Fibonacci price resistance levels. These can be seen on the weekly chart below and include a 461.8% retracement, a 141.4% projection, and a 261.8% retracement.
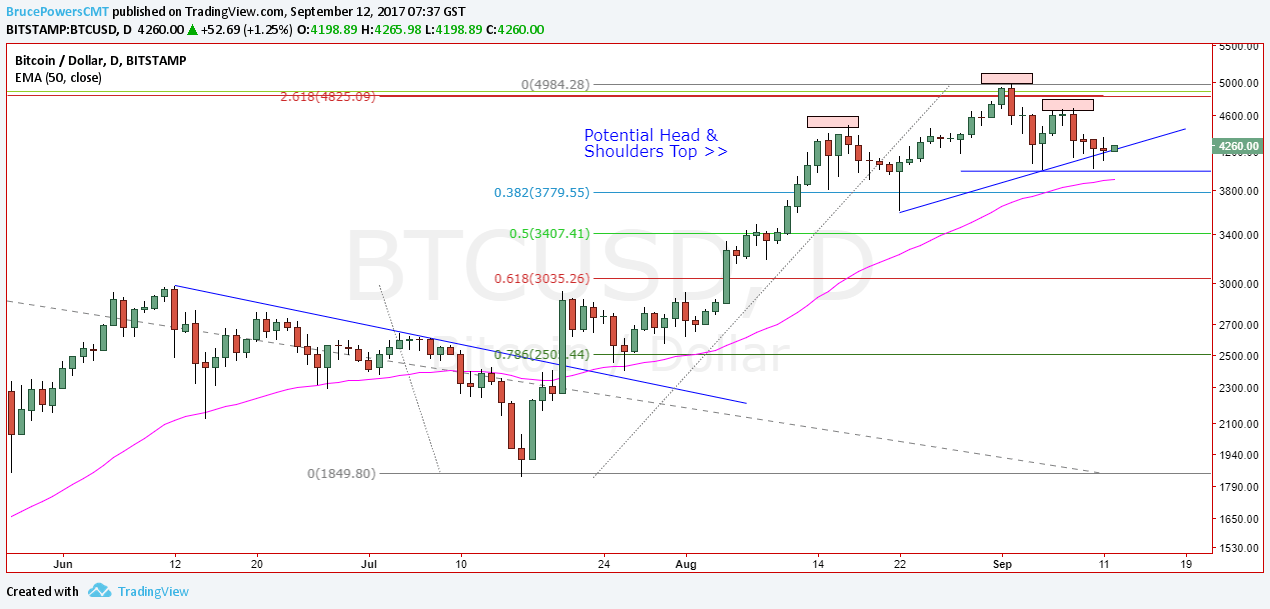
Head & Shoulders Top
Further compounding the short-term bearish case is the potential head and shoulders top now present on the daily chart. A breakdown trigger occurs on a move below $4,001.93 with the minimum target approximately $3,024, based on the measurement of the pattern. That target is also very close to the 61.8% retracement thereby increasing the significance of the $3,080 to $3,024 target zone.
Author

Bruce Powers, CMT
Markets Today
Bruce Powers, CMT, is a global markets technical analyst covering stocks, market indices, and ETFs, cryptocurrencies, Forex, oil and metals.


