Ichimoku cloud analysis: EUR/USD, USD/JPY, NZD/USD

EUR/USD, “Euro vs US Dollar”
EUR/USD has found a foothold above the signal lines of the indicator. The instrument is going below the Ichimoku Cloud, which suggests a bearish trend. A test of the lower boundary of the Cloud at 1.0905 is expected, followed by a decline to 1.0775. The decline could be additionally supported by a rebound from the upper boundary of the bearish channel. The scenario can be cancelled by a breakout of the upper boundary of the Cloud with the price finding a foothold above 1.0965, which will mean further growth to 1.1055.

USD/JPY, “US Dollar vs Japanese Yen”
USD/JPY is rising within a bullish channel. The instrument is going above the Ichimoku Cloud, which suggests an uptrend. A test of the Kijun-Sen line at 147.85 is expected, followed by a rise to 151.25. An additional signal confirming the rise will be a rebound from the lower boundary of the bullish channel. The scenario can be cancelled by a breakout of the lower boundary of the Cloud with the price finding a foothold under 144.75, which will mean a further decline to 143.85.

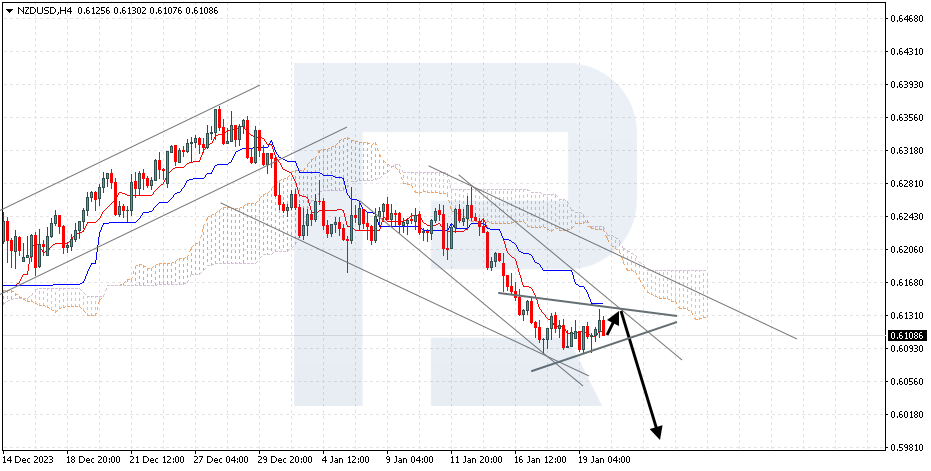
NZD/USD, “New Zealand Dollar vs US Dollar”
NZD/USD is correcting within a Triangle pattern. The instrument is going below the Ichimoku Cloud, which suggests a downtrend. A test of the Kijun-Sen line at 0.6135 is expected, followed by a decline to 0.5985. An additional signal confirming the decline will be a rebound from the upper boundary of the Triangle pattern. The scenario can be cancelled by a breakout of the upper boundary of the Cloud with the price finding a foothold above 0.6215, which will mean further growth to 0.6305. Meanwhile, the decline could be confirmed by a breakout of the lower boundary of the Triangle with the price finding a foothold under 0.6075.
Author

RoboForex Team
RoboForex
RoboForex Team is a group of professional financial experts with high experience on financial market, whose main purpose is to provide traders with quality and up-to-date market information.


