|

Ichimoku cloud analysis: EUR/USD, NZD/USD, USD/CAD

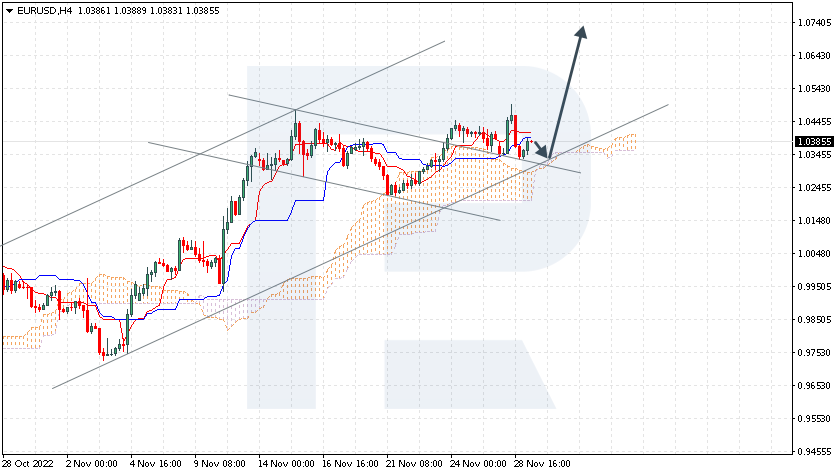
EUR/USD, “Euro vs US Dollar”

EURUSD has secured under the signal lines of the indicator. The instrument is going above the Ichimoku Cloud, which suggests an uptrend. A test of the upper border of the Cloud at 1.0345 is expected, followed by growth to 1.0745. An additional signal confirming the growth will be a bounce off the lower border of the bullish channel. The scenario can be cancelled by a breakaway of the lower border of the Cloud and securing under 1.0155, which will mean further falling to 1.0065.

Chart

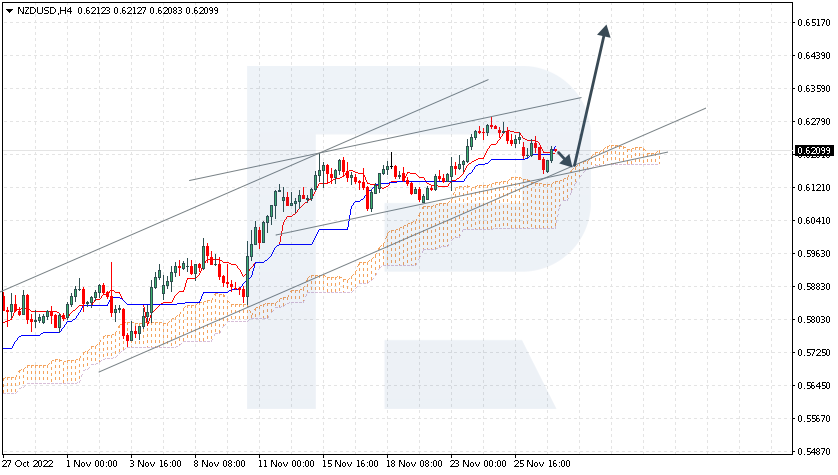
NZD/USD, “New Zealand Dollar vs US Dollar”

NZDUSD is correcting inside a bullish channel. The instrument is going above the Ichimoku Cloud, which suggests an uptrend. A test of the upper border of the Cloud at 0.6175 is expected, followed by growth to 0.6525. An additional signal confirming the growth will be a bounce off the lower border of the bullish channel. The scenario can be cancelled by a breakaway of the lower border of the Cloud and securing under 0.6010, which will mean further falling to 0.5915.

Chart

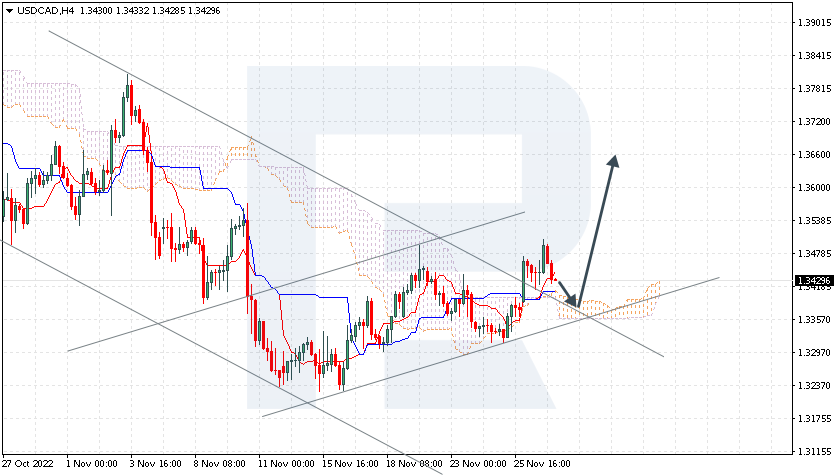
USD/CAD, “US Dollar vs Canadian Dollar”

The currency pair has pushed off the resistance level. The instrument is going above the Ichimoku Cloud, which suggests an uptrend. A test of the upper border of the Cloud at 1.3365 is expected, followed by growth to 1.3660. An additional signal confirming the growth will be a bounce off the upper border of the descending channel. The scenario can be cancelled by a breakaway of the lower border of the Cloud and securing under 1.3305, which will mean further falling to 1.3210.

Chart

Author

RoboForex Team

RoboForex Team is a group of professional financial experts with high experience on financial market, whose main purpose is to provide traders with quality and up-to-date market information.

More from RoboForex Team
Share:

Editor's Picks

EUR/USD stays near 1.1650 with fading momentum

EUR/USD holds ground after five days of losses, trading around 1.1650 during the Asian hours on Friday. The 14-day Relative Strength Index momentum indicator at 39 trends lower, confirming fading momentum rather than oversold conditions.

GBP/USD remains below 1.3450, nine-day EMA

GBP/USD remains subdued for the fourth consecutive day, trading around 1.3430 during the Asian hours on Friday. The momentum indicator 14-day Relative Strength Index at 51.9 is neutral, reflecting slower momentum after firm recent readings. An RSI drop back beneath 50 would strengthen the case for a deeper pullback.

Gold edges lower as USD preserves its recent gains ahead of US NFP report

Gold struggles to capitalize on the previous day's goodish rebound from the vicinity of the $4,400 mark and attracts fresh sellers during the Asian session on Friday. The US Dollar preserves its gains registered over the past two weeks and touches a nearly one-month high, undermining the commodity. 

Bitcoin, Ethereum and Ripple find key support, reviving rally hopes

Bitcoin, Ethereum, and Ripple steadied above key support levels on Friday after being rejected at mid-week resistance zones. The short-term recovery prospects remain intact if the top three cryptocurrencies by market capitalization hold these support zones.

2026 economic outlook: Clear skies but don’t unfasten your seatbelts yet

Most years fade into the background as soon as a new one starts. Not 2025: a year of epochal shifts, in which the macroeconomy was the dog that did not bark. What to expect in 2026? The shocks of 2025 will not be undone, but neither will they be repeated.

Pepe Price Forecast: PEPE risks 100-day EMA fallout as bullish interest fades

Pepe is under extreme selling pressure, trading in the red for the fifth consecutive day, down 1% at press time on Friday. Pepe’s decline following a 72% hike last week suggests a likely profit-booking phase, while on-chain data indicates declining network activity.