Hurry up

In one day this week, we went from “transitory” to “Holy smoke!” Not so long ago the question the Fed addressed was “should we start reducing our monthly bond purchases?” Less than a month later, the question is “should we reduce our purchases by more than we planned”?
The change was evident in comments from San Francisco Fed President Daly, a voting member of the rate-setting Federal Open Market Committee (FOMC) and one of its more dovish members. Speaking to Yahoo! Finance, she said, “I certainly see a case to be made for speeding it up…if things continue to do what they've been doing, then I would completely support an accelerated pace of tapering.”
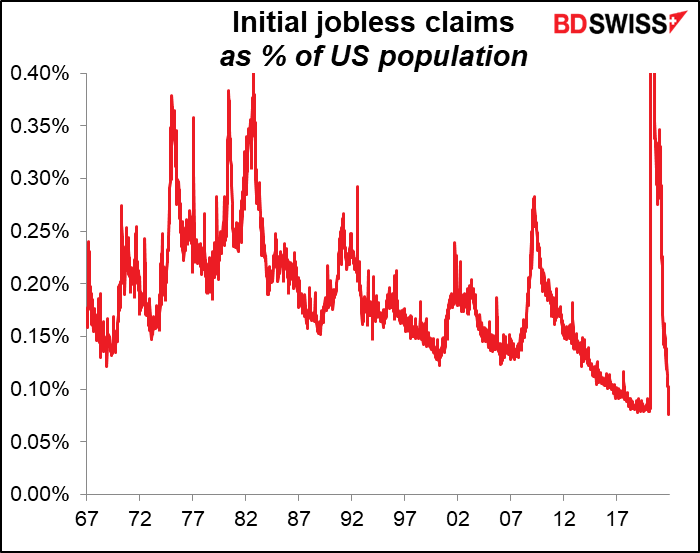
The “things” she was referring to are the labor market and inflation, the two parts of the Fed’s “dual mandate.” We got important news about both of those on Wednesday when the weekly initial jobless claims plunged by 71k to 199k, the lowest level since November 1969 (data back to 1967).
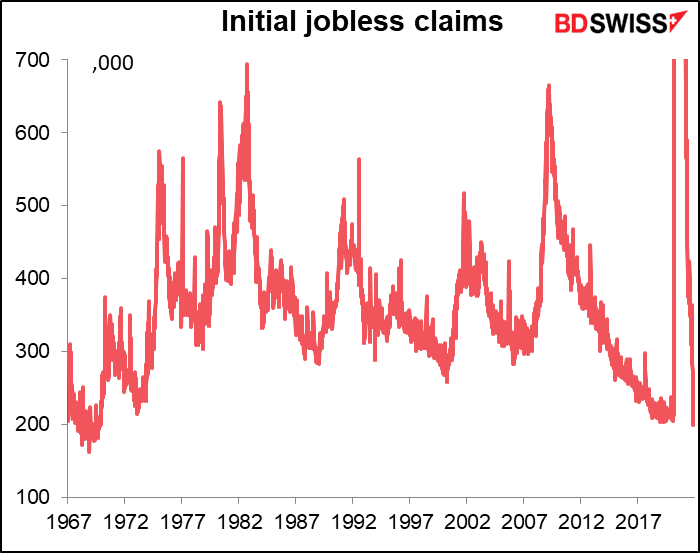
This is all the more amazing because of course the jobless claims aren’t adjusted for the growth of the population over the years. If we take the figure as a percent of the population, they were the lowest on record.
Now, these are seasonally adjusted figures – the unadjusted figures were good but not as spectacular (unusually warm weather allowed people to keep working in construction longer than usual into the autumn, thereby lifting the seasonally adjusted data). Still, it looks increasingly like the US labor market is rapidly healing. We’ll learn more about the US labor market next Friday when the November US nonfarm payrolls are announced.
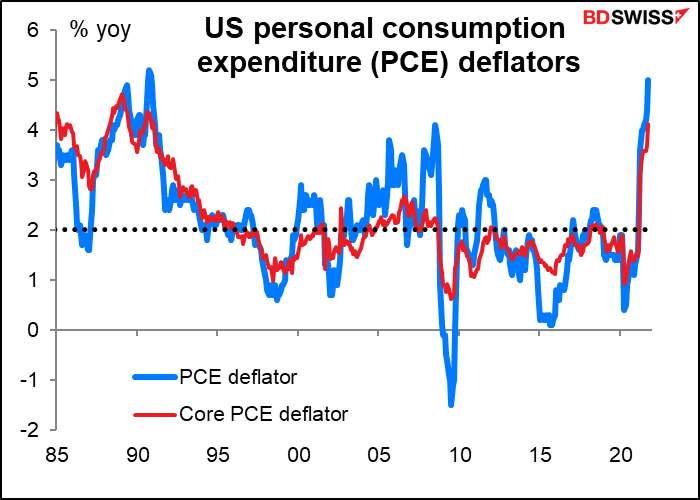
Secondly, the US personal consumption expenditure (PCE) deflators showed inflation continues to soar past the Fed’s 2% target. The data came in almost exactly as expected. The headline figure was a bit less (+5.0% YoY vs +5.1% expected, 4.4% previous) but the core PCE deflator, which is the more important one, was spot on at +4.1% YoY (3.6% previous). These rates, the fastest rise in prices since the 1990s, are of course outrageous compared to the Fed’s 2% target.
The next PCE figures are on Dec. 23rd, after the Dec. 15th FOMC meeting, but the November US consumer price index (CPI) is coming out on the 10th so the Committee will have that to hand when they meet. (I was interest to note that in her interview, Daily focused on the CPI and not on the PCE deflator, which is supposed to be the Fed’s preferred inflation gauge.)
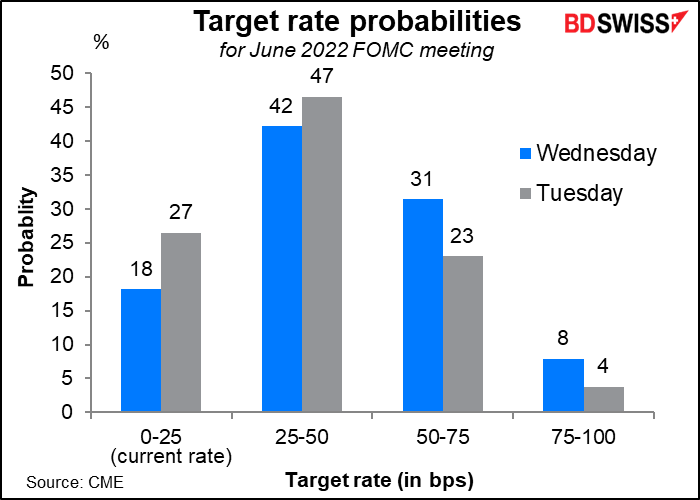
The Fed has said it won’t start raising rates (“lift-off”) until it’s finished with its bond purchases – why take accommodation away with one hand while still providing it with the other? The speed of the tapering, therefore, determines how soon they can start raising rates. After Wednesday’s news, the market now thinks the odds favor the first-rate hike in May rather than in June as was previously the case.
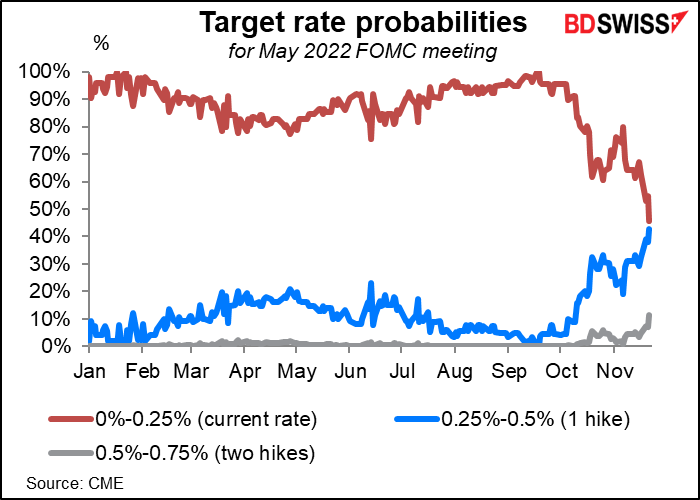
And an increasing chance of a second hike in June.
Rates rising more rapidly than expected is positive for the dollar: the famous “monetary policy divergence” theme.
Note: I write this Weekly on Thursday to send out Friday. Friday morning we got news of the discovery of a new, more easily transmitted COVID-19 variant in South Africa. This new variant poses several risks to the above scenario:
-
More countries may have to go into lockdown.
That could reduce global economic activity, which is bad for commodity currencies. By restricting travel, it could restrict demand for oil, which is particularly bad for CAD – not to mention the price of oil as well of course.
-
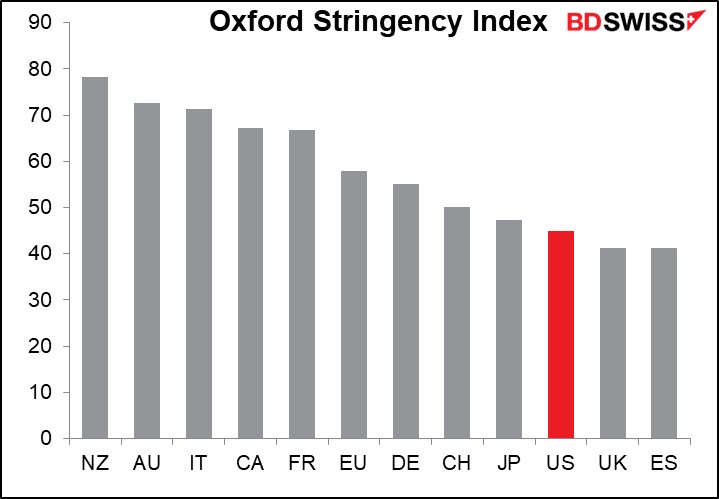
The US is uniquely vulnerable among the major industrial countries to the variant.
The US has the lowest vaccination rate of any major country.
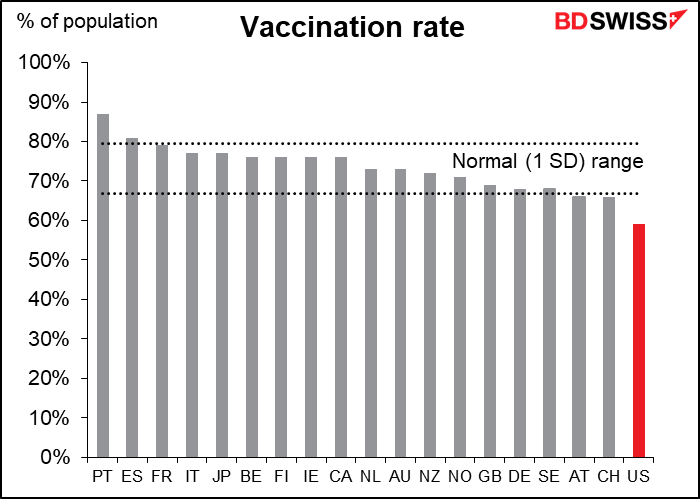
Furthermore, national lockdowns are legally impossible and many states refuse to countenance even mask mandates, much less lockdown. As a result the US has among the loosest restrictions of any major country at the moment and little prospect of tightening them significantly. The US is thus uniquely vulnerable among major countries to a more easily transmitted version of the virus.
-
A significant worsening of the global virus crisis could force the Fed to refrain from hiking rates. That would have repercussions for other countries, which might hesitate to tighten policy in the absence of any Fed move for fear of seeing their currency appreciate.
-
A worsening of the pandemic might present a major conundrum to all central banks as inflation worsened while economic activity slowed. As San Francisco Fed President Daly said in the interview mentioned above:
-
The thing that is often in the background, but is probably the most important thing, is getting COVID behind us. Because when you look across the globe, the key reason we have so many imbalances is that there's so much episodic downtime on the part of suppliers, whether they're distributors or the actual builders of goods. They just can't keep their factories running, or their distribution networks running, at full capacity, because we still have a health crisis. So those are all the factors that will have a more immediate effect on inflation.
Next week: US payrolls, Powell/Yellen testimony, German & EU CPI, OPEC+ meeting.
Following the stunning initial jobless claims, the focus will be squarely on Friday’s US employment report to see if this one data point marks a fluke or an inflection point.
The forecast for the nonfarm payrolls is +500k, about the same as in October.
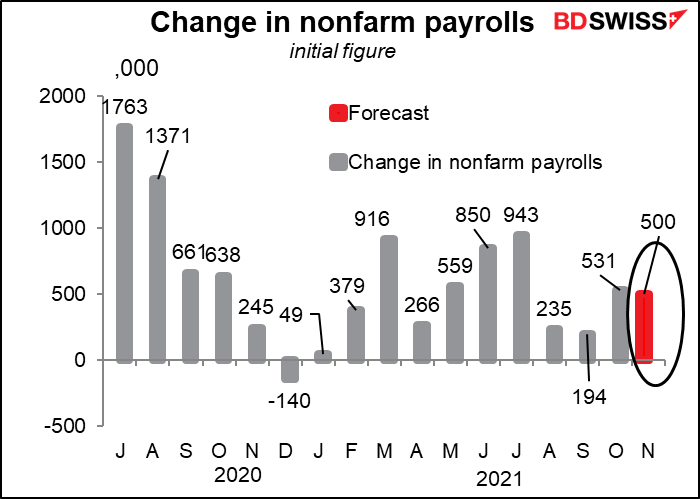
Will a figure like this be enough to get the Fed to accelerate its taper? In his press conference following the November FOMC meeting, Fed Chair Powell said,
Are we going to start to see over the winter significant increases in jobs again? If you look back to three, six, and nine-month average job creation is between (320k to 550k). So, if you think of that as a stronger, you don’t have to think back to the million job months of June and July, you can just think, okay, 550 to 600 (thousand), we should get back on that path, then we would be making good progress. And we’d like to see that of course. So, we’ll know so much more and believe me, we understand it’s a different world in so many ways and we’re very open to that.
In other words, the forecast increase in jobs of +500k would be considered “making good progress” and therefore probably be enough to get them to increase their taper (i.e., decrease their monthly bond purchases at a faster pace and end them sooner.)
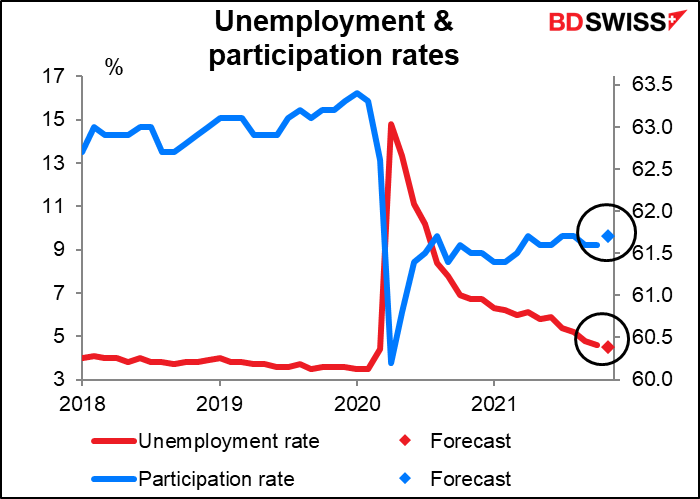
Meanwhile, the unemployment rate is expected to creep down and the participation rate to creep up. That would be good news on both fronts. At 4.5%, the unemployment rate would still be above what the FOMC members estimate the “longer-run” level for unemployment is, as laid out in their Summary of Economic Projections, but it’s getting closer. The question might be whether they consider that to be “maximum employment” or whether they aim to reach the pre-pandemic low of 3.5% once again. Is this one of the ways in which “it’s a different world”?
Average hourly earnings are expected to rise by 5.0% YoY, up slightly from 4.9%. This puts them right at the PCE deflator, meaning if they go any higher it could be the start of a wage/price spiral. That would be another reason to accelerate the taper – an economy like that doesn’t need any assistance.
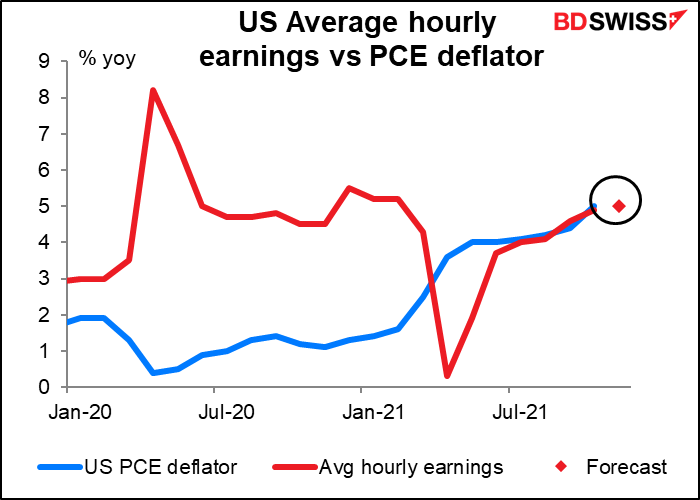
Of course, much depends on who is getting the additional money and why. If it stems from productivity increases or – like now – it’s people at the lower end of the wage scale finally making up for lost ground as the capitalist robber barons begrudgingly concede that their serf's employees ought to earn enough money to live on – then I think the Fed would be OK with that. (About 70% of the 21mn people poor enough to receive federal aid benefits such as food stamps work full time, with Walmart and McDonald’s being the largest beneficiaries of what amounts to corporate welfare.)
Speaking of the Fed, Chair Powell and his predecessor-now-Treasury Secretary Janet Yellen will testify in Congress on Tuesday and Wednesday about the Coronavirus Aid, Relief, and Economic Security (CARES) Act. I’m kind of surprised because they went through this dog-and-pony show at the end of September too. Before that it was March, so I assumed it was every six months. You can watch the testimony live if you want. While the prepared statements focus on the CARES act, the questions can be about anything, so look for Chair Powell to get grilled on inflation and tapering and for Treasury Secretary Yellen to make some anguished pleas about the debt ceiling.
The Fed releases the “Summary of Commentary on Current Economic Conditions,” aka The Beige Book on Wednesday as always two weeks before the next FOMC meeting. It’s significant for the market because the first paragraph of the statement following each FOMC meeting tends to mirror the tone of the Beige Book's characterization of the economy. The book doesn’t have any number attached to it that quantifies its contents, but many research firms calculate a “Beige Book index” by counting how many times various words appear, such as “uncertain.” In any case, the book is largely anecdotal so you’ll just have to watch the headlines as they come out.
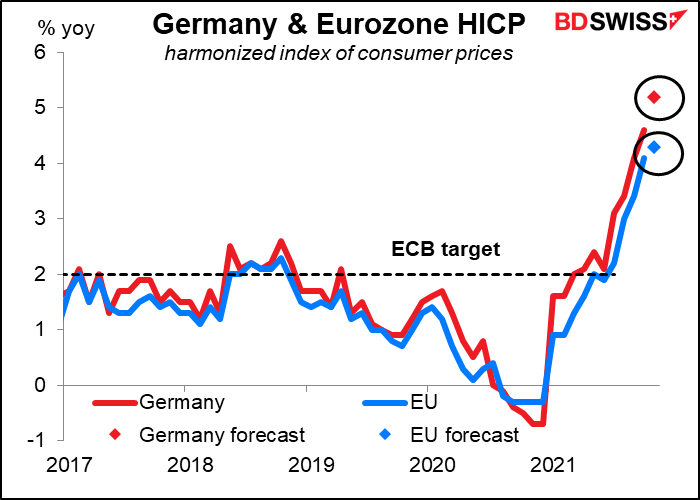
For the EU, the big event will be the German CPI on Monday followed as always by the EU-wide CPI the next day. They’re expected to be significantly higher – Germany’s harmonized index of consumer prices (HICP) rising 0.6 percentage points to 5.2%yoy and EU-wide HICP rising 0.2 ppt to 4.3%. This figure, double the European Central Bank’s 2% target, will no doubt be a big topic of discussion at the Dec. 16th ECB Governing Council meeting, when the assembled grandees have to decide what to do about their EUR 1.85tn Pandemic Emergency Purchase Program (PEPP), which is scheduled to wrap up at the end of March. High inflation could increase the odds that the ECB cuts down its bond purchases, which would be bullish for EUR.
Against the surging inflation though will be the surging virus cases in the Eurozone.
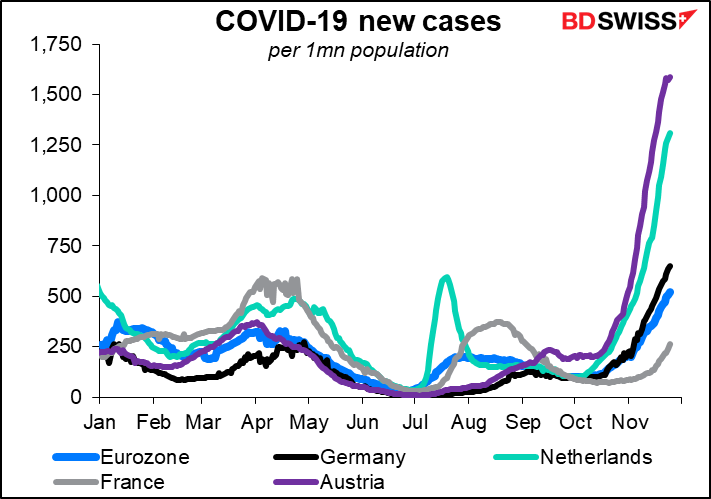
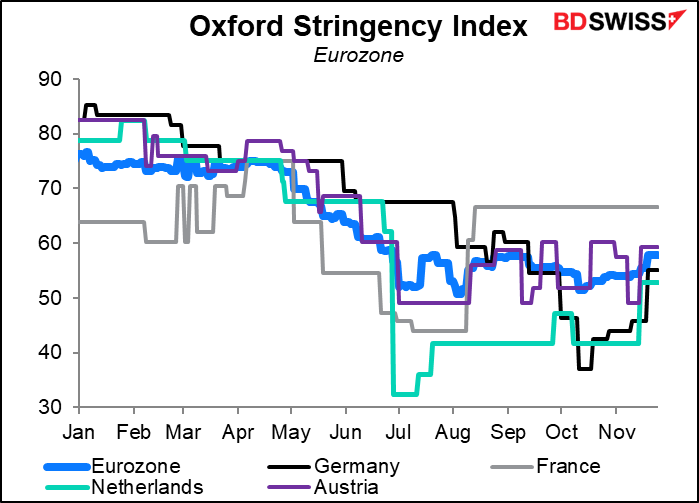
Austria has gone back into lockdown, the Netherlands has imposed partial lockdown and Germany considered but rejected the idea. But as countries reimpose restrictions, there have been demonstrations and riots in several countries against the measures. This puts the EU – and the ECB – in a conundrum. The PEPP “is a non-standard monetary policy measure initiated in March 2020 to counter the serious risks to the monetary policy transmission mechanism and the outlook for the euro area posed by the coronavirus (COVID-19) outbreak.” Inflation may well be above their 2% target, but with the virus caseload breaking previous records in several Eurozone countries, can they honestly say that the “serious risks…posed by the coronavirus outbreak” are over?
The feathers may fly when the hawks and doves confront each other on Dec. 16th.
Oil will be in the news next week too as OPEC committees meet four times: the Joint Technical Committee on Monday, the Joint Ministerial Monitoring Committee on Tuesday, an OPEC-members-only ministerial meeting on Wednesday, and a full OPEC+ ministerial meeting on Thursday. Until Wednesday this regular monthly meeting was likely to be just another rubber stamp meeting to agree to stick with their existing plan to increase output by 400k barrels a day. But the decision by the US and six other oil-consuming countries to release oil from their Strategic Petroleum Reserves (SPR) was seen as a poke in the eye of OPEC+ that could elicit retaliation from the cartel, for example, a pause in their output increases. OPEC+ could entirely offset the US SPR release of 50mn barrels by simply pausing their output increases for four months.
A decision to cut back or even pause the planned output hikes would push up oil prices and probably CAD and NOK, too.
Why might OPEC+ do that? The group expects – and the US agrees, by the way – that the oil market is likely to be oversupplied next year and prices will fall. OPEC’s Economic Commission Board, a group of economists that advise the cartel, Thursday wanted that the increase from the various SPRs, possibly totaling 66mn barrels, would swell the global surplus by 1.1mn barrels a day (b/d) to 2.3mn b/d in January and 3.7mn b/d in February. This is a difference in degree, not direction, from the outlook in the US Energy Information Agency’s Short-Term Energy Outlook of Nov. 9th, which forecast that “growth in production from OPEC+, U.S. tight oil, and other non-OPEC countries will outpace slowing growth in global oil consumption” next year and that the market will be oversupplied by 500k b/d. As a result Brent prices would average $72/bbl, down from their estimate of $82/bbl in Q4 this year, the EIA forecast.
The new COVID-19 variant and the risk of further travel restrictions and lockdowns will only confirm OPEC’s doubts about the trajectory of oil prices.
The sad fact is, higher oil prices are needed to accomplish another goal of President Biden’s, that is, the switch to renewable energy. Nothing encourages investment in windmills and solar panels quite like $100/bbl oil. Not to mention that higher oil prices will be necessary to offset the risks involved in undertaking further exploration and development of long-term oil projects against the background of increasing ESG pressure to move away from fossil fuels. Otherwise there’s a risk of a serious, debilitating spike in prices at some point in the decades before the transition to renewable energy is complete.
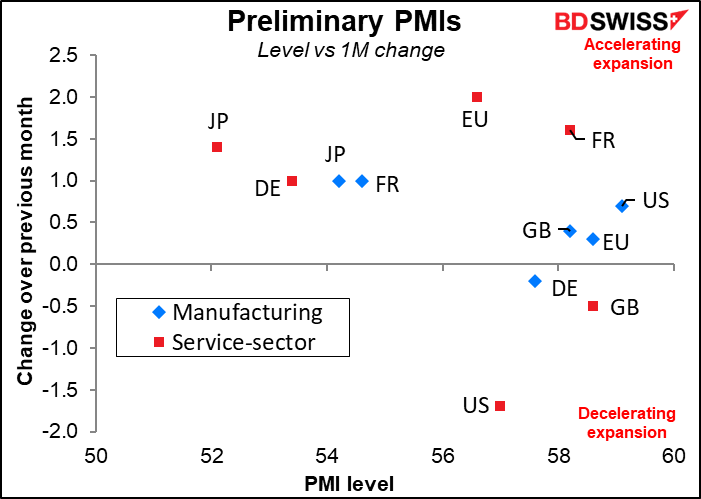
As usual, the manufacturing purchasing managers’ indices (PMIs) will be released on the first of the month (Wednesday) and the service-sector PMIs on the third (Friday). The preliminary PMIs for the major industrial economies showed that they are all in expansionary territory and most showed an improvement from the previous month, which was a surprise in several cases. If this good performance is replicated across other countries it could spur thoughts of a faster-than-expected recovery that might boost demand for commodities and hence would be positive for the risk-sensitive AUD, NZD, and CAD.
The end of the month brings the usual Japan data dump, with retail sales on Monday, employment and industrial production on Tuesday, and Q3 capital spending on Wednesday. I’m not going to bother with a graph of these though because JPY is generally impervious to most economic indicators at the moment.
Finally, as it’s the month-end next week, there will be the usual month-end FX portfolio rebalancing. US markets have outperformed in USD terms, aided by a strong currency. The net result is likely to be some USD selling/currency buying, particularly vs NZD and AUD.
Author

Marshall Gittler
Trading Analysis


