Hurricanes Drive Down NFP
Good Morning Traders,
As of this writing 4:20 AM EST, here's what we see:
US Dollar: Dec. USD is Down at 93.615.
Energies: Nov Crude is Up at 49.55.
Financials: The Dec 30 year bond is Up 3 ticks and trading at 152.00.
Indices: The Dec S&P 500 emini ES contract is 10 ticks Higher and trading at 2547.50.
Gold: The Dec gold contract is trading Up at 1282.50. Gold is 75 ticks Higher than its close.
Initial Conclusion
This is not a correlated market. The dollar is Down- and Crude is Up+ which is normal but the 30 year Bond is trading Higher. The Financials should always correlate with the US dollar such that if the dollar is lower then bonds should follow and vice-versa. The indices are Higher and Crude is trading Up+ which is not correlated. Gold is trading Up which is correlated with the US dollar trading Down-. I tend to believe that Gold has an inverse relationship with the US Dollar as when the US Dollar is down, Gold tends to rise in value and vice-versa. Think of it as a seesaw, when one is up the other should be down. I point this out to you to make you aware that when we don't have a correlated market, it means something is wrong. As traders you need to be aware of this and proceed with your eyes wide open.
At this hour Asia is trading mainly Higher with the exception of the Aussie and Hang Seng which are trading Lower. As of this writing all of Europe is trading mainly Higher with the exception of the London exchange which is fractionally Lower at this hour..
Possible Challenges To Traders Today
-
No major economic news to speak of.
-
Lack of major economic news.
Treasuries
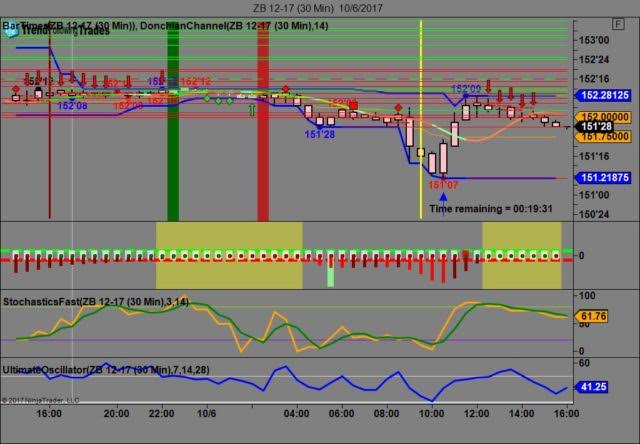
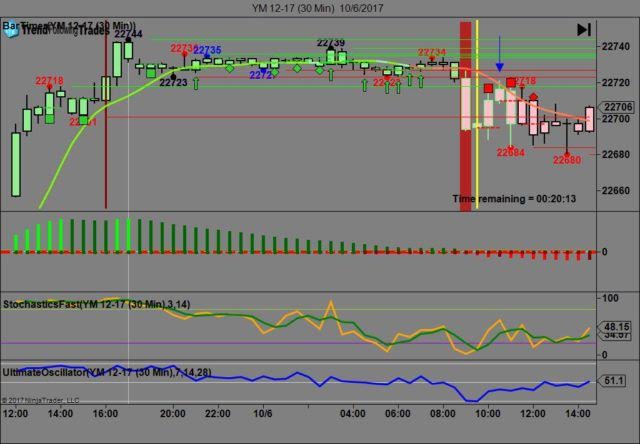
We've elected to switch gears a bit and show correlation between the 30 year bond (ZB) and The YM futures contract. The YM contract is the DJIA and the purpose is to show reverse correlation between the two instruments. Remember it's liken to a seesaw, when up goes up the other should go down and vice versa.
On Friday the ZB made it's move at around 10:30 AM EST after the major economic news was reported. The ZB hit a Low at around that time and the YM hit a High. If you look at the charts below ZB gave a signal at around 10:30 AM EST and the YM was moving Lower at the same time. Look at the charts below and you'll see a pattern for both assets. ZB hit a Low at around 10:30 AM and the YM hit a High. These charts represent the newest version of Trend Following Trades and I've changed the timeframe to a 30 minute chart to display better. This represented a Long opportunity on the 30 year bond, as a trader you could have netted about 20 plus ticks per contract on this trade. Each tick is worth $31.25. We added a Donchian Channel to the charts to show the signals more clearly. Please note that the front month for the ZB and the YM contract is now December, 2017.
Charts Courtesy of Trend Following Trades built on a NinjaTrader platform
Bias
On Friday our bias was Neutral as it was Jobs Friday or Non Farm Payrolls (NFP) and we always maintain a Neutral bias on that day. The Dow dropped 2 points, the S&P fell by 3 and the Nasdaq gained 5. All in all a mixed or neutral day. Today we aren't dealing with a correlated market and our bias is neutral.
Could this change? Of Course. Remember anything can happen in a volatile market.
Commentary
On Friday we called for a Neutral bias as is our custom for Jobs Friday. As it turned out it seems that the US economy lost about 33,000 jobs as a direct result of Hurricanes Harvey in Texas and Irma in Florida. I do not recall such a thing happening even after Superstorm Sandy in 2012. Now some may be wondering how could that happen? In the states where Hurricane Harvey and Irma landed, those states have very lax employment laws and are free to hire and fire at will whereas the states where Sandy hit (NJ, NY) those states have far stronger employment laws and regulations. The true telltale sign will be next months' Non Farm Payroll report. Stay tuned....
Author

Nick Mastrandrea
Market Tea Leaves


