How will silver’s (SLV) recent spike end?

When Joe Public buys shares during a wave of euphoria, they do it close to a market top or before the beginning of a decline. Looking at you, SLV!
Silver rallied on Friday (Jan. 29), gold reversed its direction before the end of the day and so did miners, with the latter slightly underperforming gold. I wrote this before, and I'll stress this once again today – the above is a perfectly bearish indication of an upcoming downturn in the precious metals market. This is not the first time it's happening, and this combination of relative strengths worked reliably in the past. And we are not only just seeing that happening – we are seeing that at precisely the moment that is similar to previous patterns that were followed by sizable declines, which means that the relative bearish factors are even stronger.
This also applies to the huge inflows to the SLV ETF that we just saw most recently. Let's take a look below.
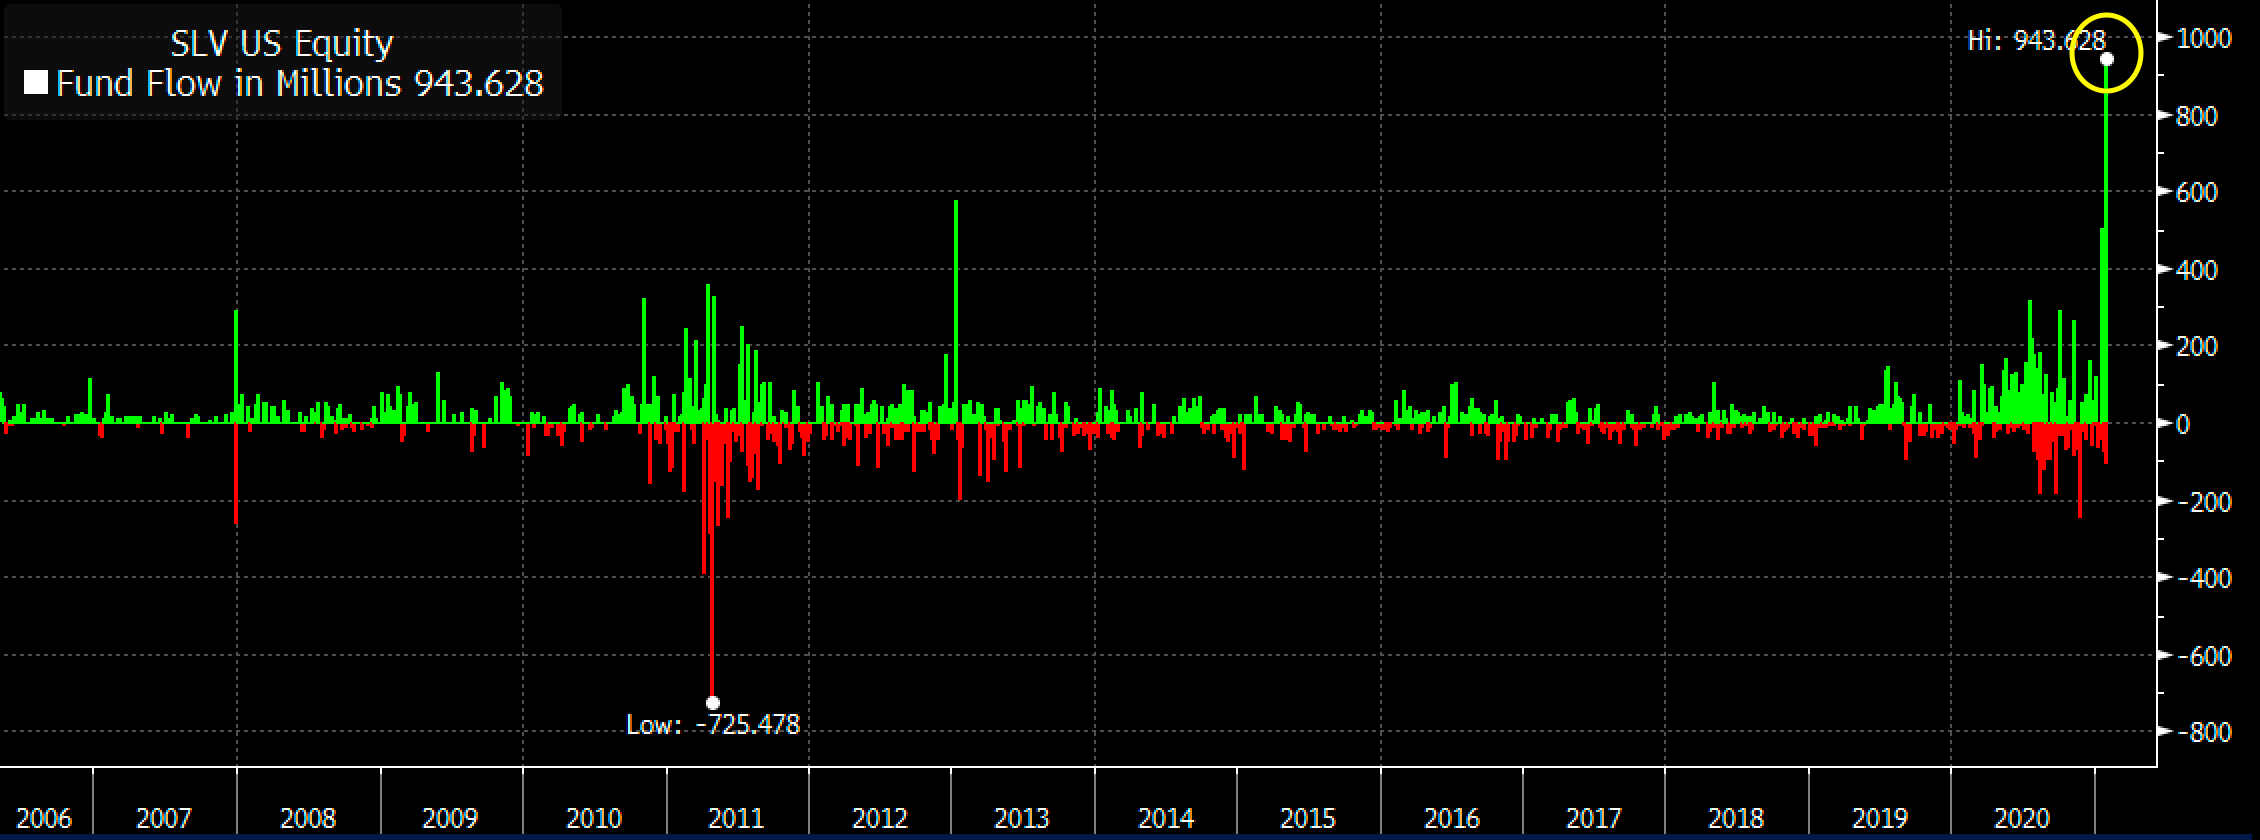
Figure 1
The inflows were huge, which means that a lot of capital poured into this particular silver ETF . No wonder – it was very popular among Reddit (and other forums) participants last week. Naturally, these investors are – in general – not professionals and they are not institutions either. They are part of the "investment public", which tends to buy massively close to market tops and/or before important price declines.
This indication might work on an immediate basis, but it could also work on a near-term basis – it depends on other circumstances. Did this work previously? Let's check – after all, there were two other cases when we saw big spikes in SLV inflows – at the end of 2007 and at the beginning of 2013.
What did silver do back then? I marked those situations with blue, vertical lines on the chart below.
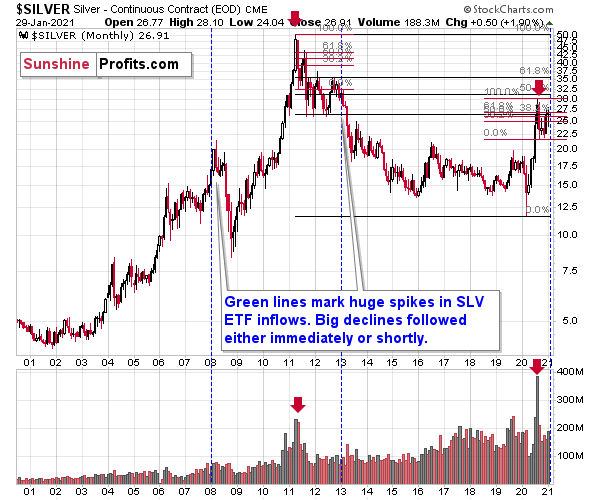
Figure 2
The beginning of 2013 was when silver was not only already after its top, but was also in the final part of the back-and- forth trading that we saw before the bigger declines in that year.
In late 2007, silver was still rallying, but it topped soon after that and subsequently plunged. At the 2008 bottom, silver was well below the levels at which the huge SLV inflows occurred.
Consequently, the spike in inflows is not a bullish sign. It's a major bearish sign for the medium term, especially knowing that it was the investment public that was making the purchases.
Also, please note that the late-2007 spike wasn't preceded by sizable inflows, but both the early 2013 and 2021 spikes were. Also, back in 2013, silver was already after a major top (just like right now) while in early 2007 it was breaking to new highs.
As of now, silver just broke to new highs, but since this move is not confirmed yet, it seems that the current situation is still a bit more similar to what we saw in 2013 than in 2007. Therefore, the scenario in which we don't have to wait long for silver's slide is slightly more probable.
The current volatility in silver suggests that the price moves are likely to be quick in both directions, so when the white metal tops it might be difficult to get out of one's long position at prices that were better than one's entry prices (provided that one joined the current sharp run-up).
Especially since stocks just declined visibly and confirmed the breakdown below the rising support line in terms of three consecutive trading days, a weekly close, and a monthly close.
Figure 3
Stocks have also invalidated their breakout above their rising red support/resistance line. And it all caused the RSI to form a double-top near the 70 level, which preceded the two biggest price declines in the previous years.
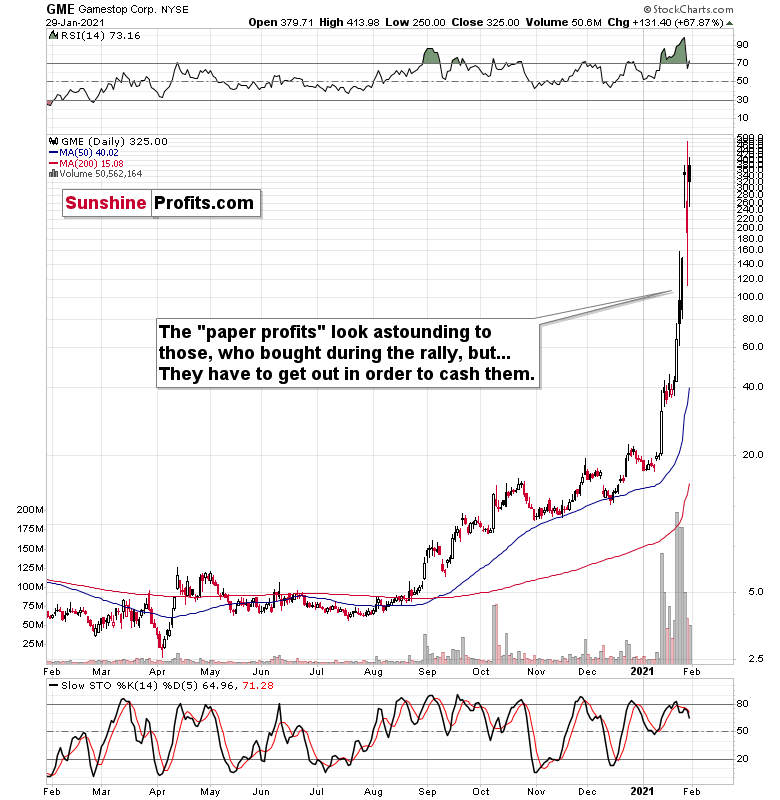
Figure 4
It seems that while the bigger investors head for the hills, the individual public continues to focus on Gamestop and its recent gains. However, remember that they have to cash in above their entry price to make a profit, which is not that probable.
The most important detail that we saw on Friday was the relatively low volume, on which Gamestop rallied. The buying power seems to be drying up and it seems that it won't be long before everyone that wanted to buy, will already be "in". And then, the price will start to slide as that's what it simply does when there are no buyers and no sellers. Afterwards, a part of the public will sell, further adding to the selling pressure, which will see more declines, and so on. And as the final stock buyers turn into sellers, the top in stocks could be in.
If stocks slide further shortly, it will be particularly bearish for silver and mining stocks, which means that those who bought yesterday based on forum messages, etc., would be likely to find themselves at a loss relatively soon. This, in turn, means that the decline could be quite volatile.
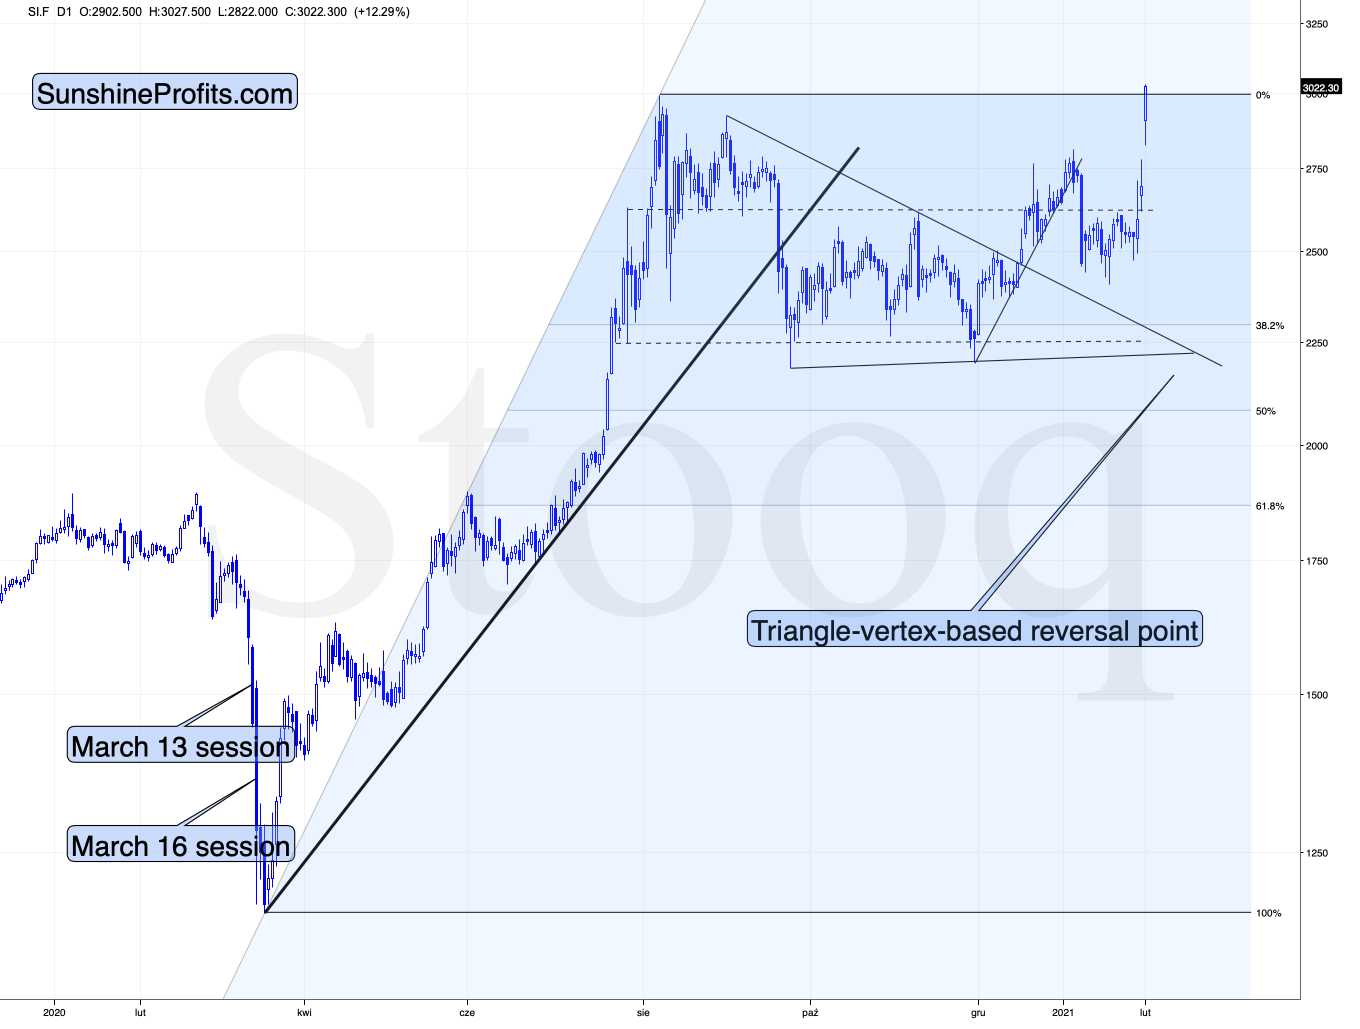
Figure 5
On a short-term basis, silver showed strength – also today, when it rallied slightly above the early-September high. Perhaps the final part of those who might have been inclined to buy based on the " silver manipulation " narrative and the forum encouragements in general, have decided to make their purchases over the weekend, and we're seeing the result in today's pre-market trading.
This, coupled with the miners' relative weakness means that the bearish outlook remains intact. If it "feels" that the precious metals market is about take off, but the analysis says otherwise (please remember about the first chart from today's analysis), then it's very likely that the PMs are topping. That's what people see and "feel" at the top.
Want free follow-ups to the above article and details not available to 99%+ investors? Sign up to our free newsletter today!
Want free follow-ups to the above article and details not available to 99%+ investors? Sign up to our free newsletter today!
Author

Przemyslaw Radomski, CFA
Gold Price Forecast
Przemyslaw Radomski, CFA (PR) is a precious metals investor and analyst who takes advantage of the emotionality on the markets, and invites you to do the same. His company, Sunshine Profits, publishes analytical software that any


