How to beat Wall Street

S2N spotlight
I must say the punchline of today’s “Spotlight" came out slightly differently to the way I was expecting; it turned out to make a much stronger point in my opinion.
A few months ago, I shared a statistic of how many active managers in the US outperformed the S&P 500 benchmark. The official numbers for 2024 are finally in, and it is not pretty. 65% underperformed the benchmark last year and 64.4% underperformed since 2021.
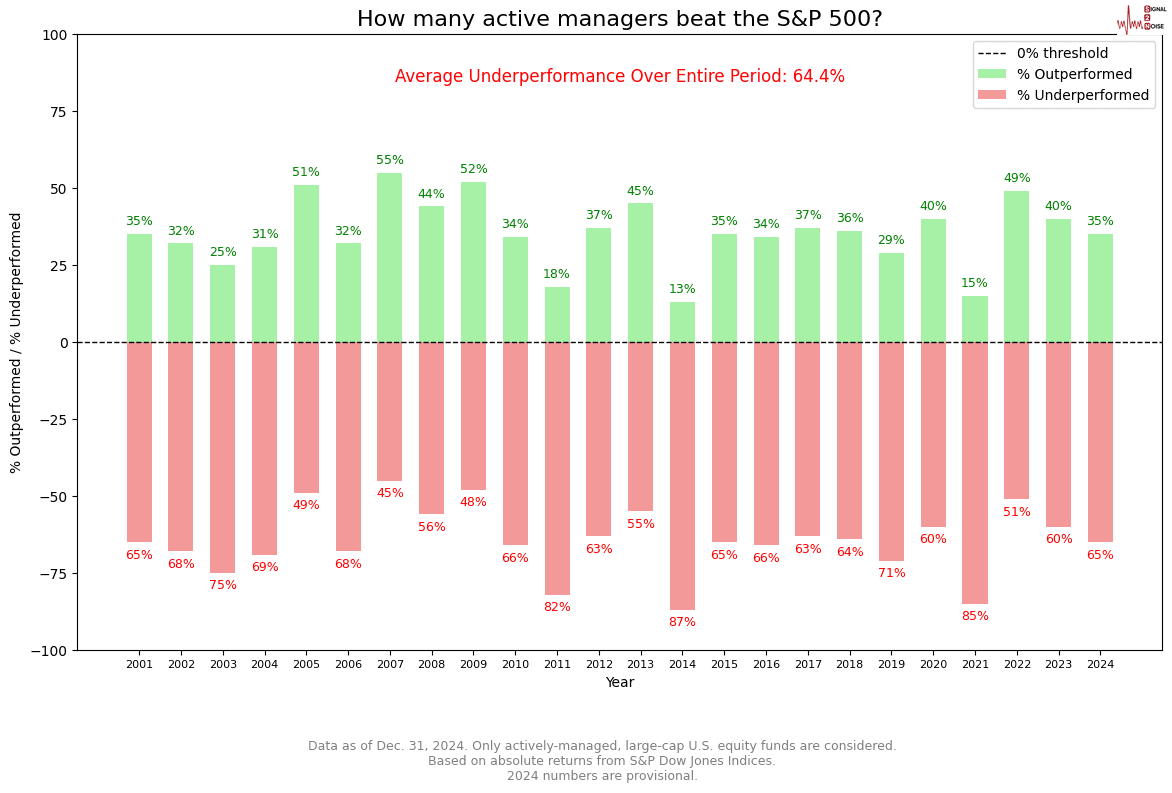
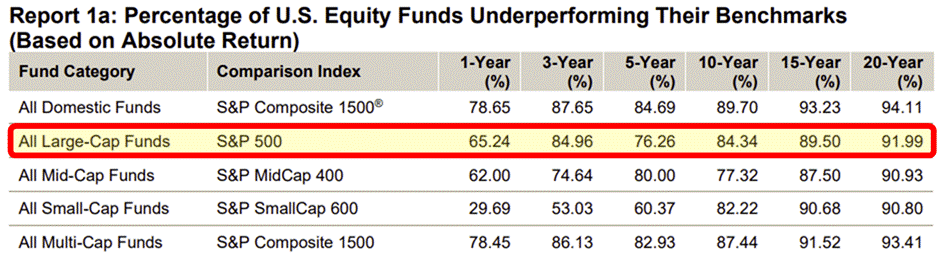
The statistic below kicks the Wall Street asset manager even further in the guts and hopelessly opens many of your eyes. Over 20 years, 92% underperform. You really need to let that sink in for a while. Most of you are paying a lot of fees to underperform with near certainty the longer time goes on.
I don’t think I could make a stronger case for index investing and diversified portfolio construction.
When I set out today with this letter, I was going to try and run a souped-up optimisation model using the brilliant RiskFolio Python library. The main author of this library is a very impressive South American (sorry, forgot the country). I once attended a webinar where he demonstrated his code’s power. I remember walking away thinking this guy has built something more powerful than the Hulk pumped full of steroids.
I literally ran dozens of variations, hoping to produce one “lucky” one that I was going to show you how I could beat the SP500 benchmark from 2001. It turned out much harder to do, if not near impossible. I was only trying to outperform on a total return basis, not looking at my preferred risk-adjusted returns. This is where things took an interesting turn. When you optimise a portfolio, it is possible for the model to lose its mind when trying to solve for a solution where it cannot quite get there and then it just falls over. I had written an if-statement that if it cannot find a solution, simply apply an equal weighted sector portfolio. Guess what? Bob’s your uncle I outperformed the benchmark and outperformed Wall Street by mistake—oops.
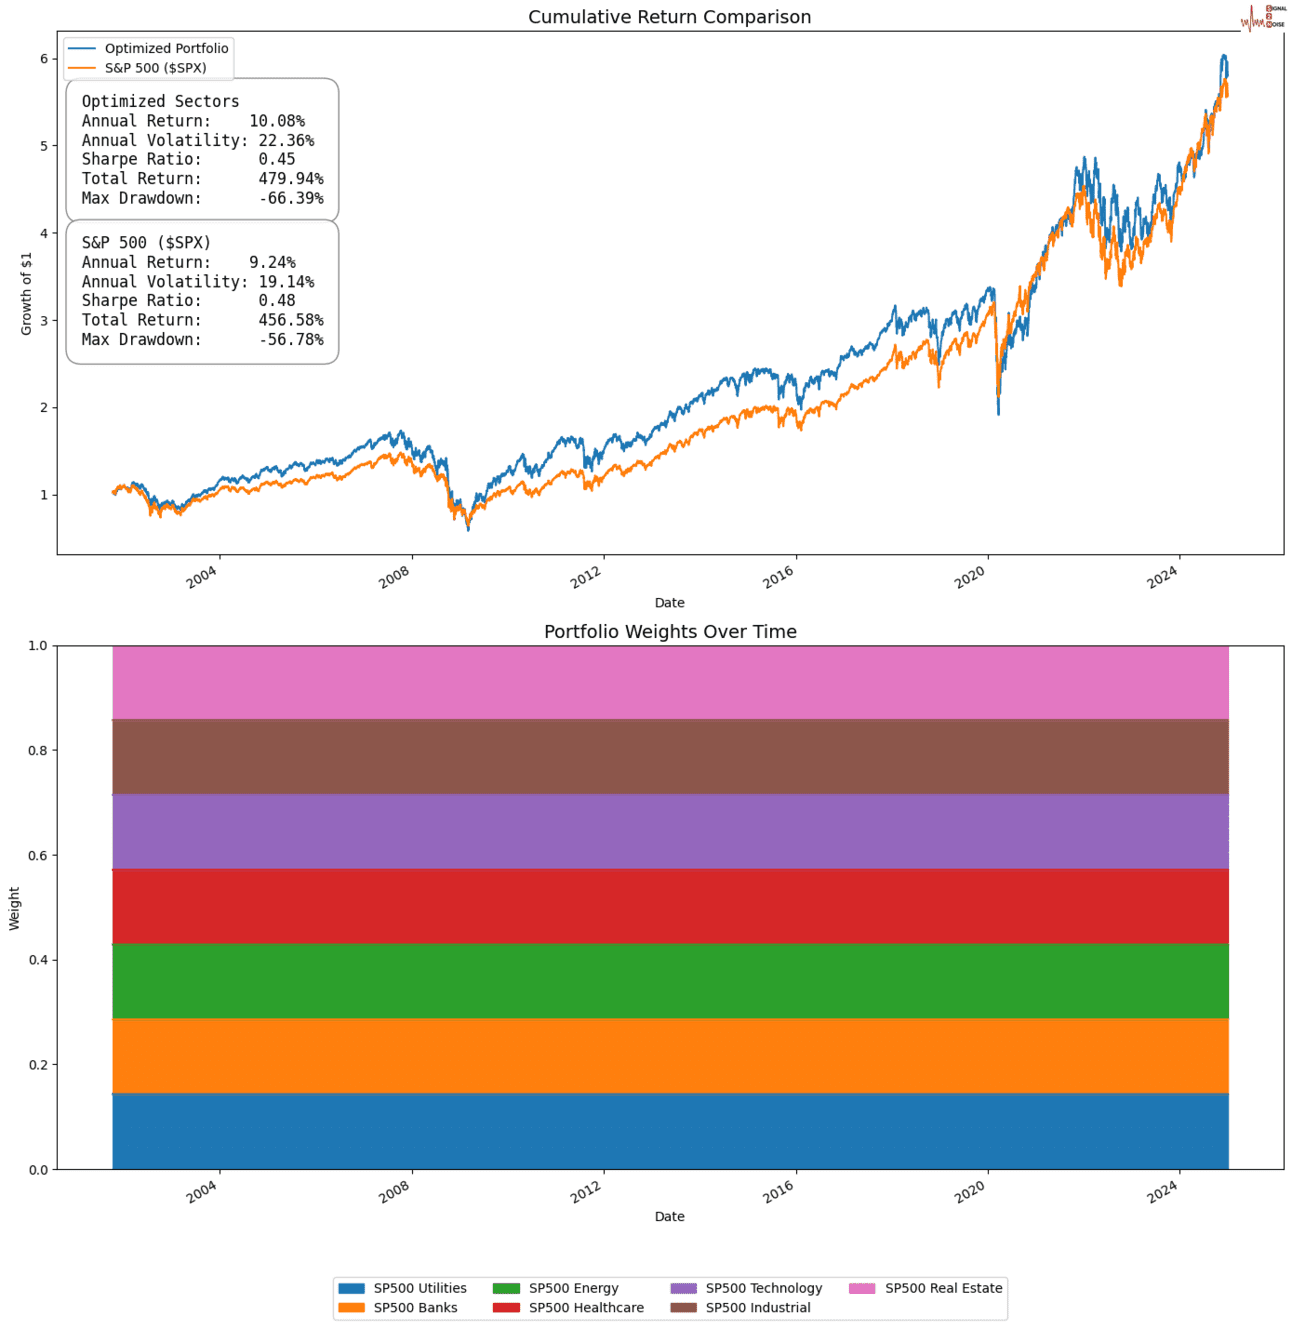
Optimized should be equal weighted
The chart actually shows perfectly how the model applied an equal weight in each sector throughout the entire duration of the analysis, and it outperformed on a total return basis, not risk-adjusted. I was not able with all my optimisation runs to outperform without feeding in bias. This further strengthens the case of how hard it is for asset managers to outperform the index over a long period of time. While Buffett no longer kills the benchmark over this time period, he does beat it over 20 years. Impressive.
S2N observations
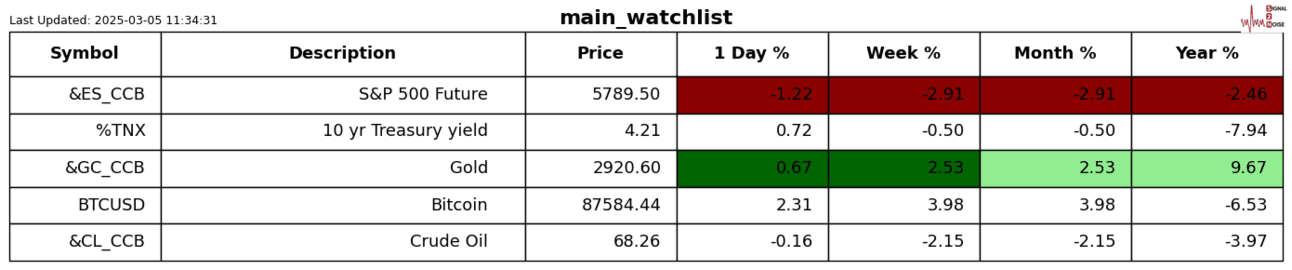
The Trump Tarriffs kicked into gear properly today. I am not a fan; I think that Trump is what the world needed to move out of its status quo, gridlock mentality. However, I think he is making a mistake here. I also feel his transactional mentality is ignoring some of economic history’s greatest lessons. This letter is not a political commentary per se; I hate politics, but economics used to be called political economy for a reason. You cannot divorce the two at a global macro level.
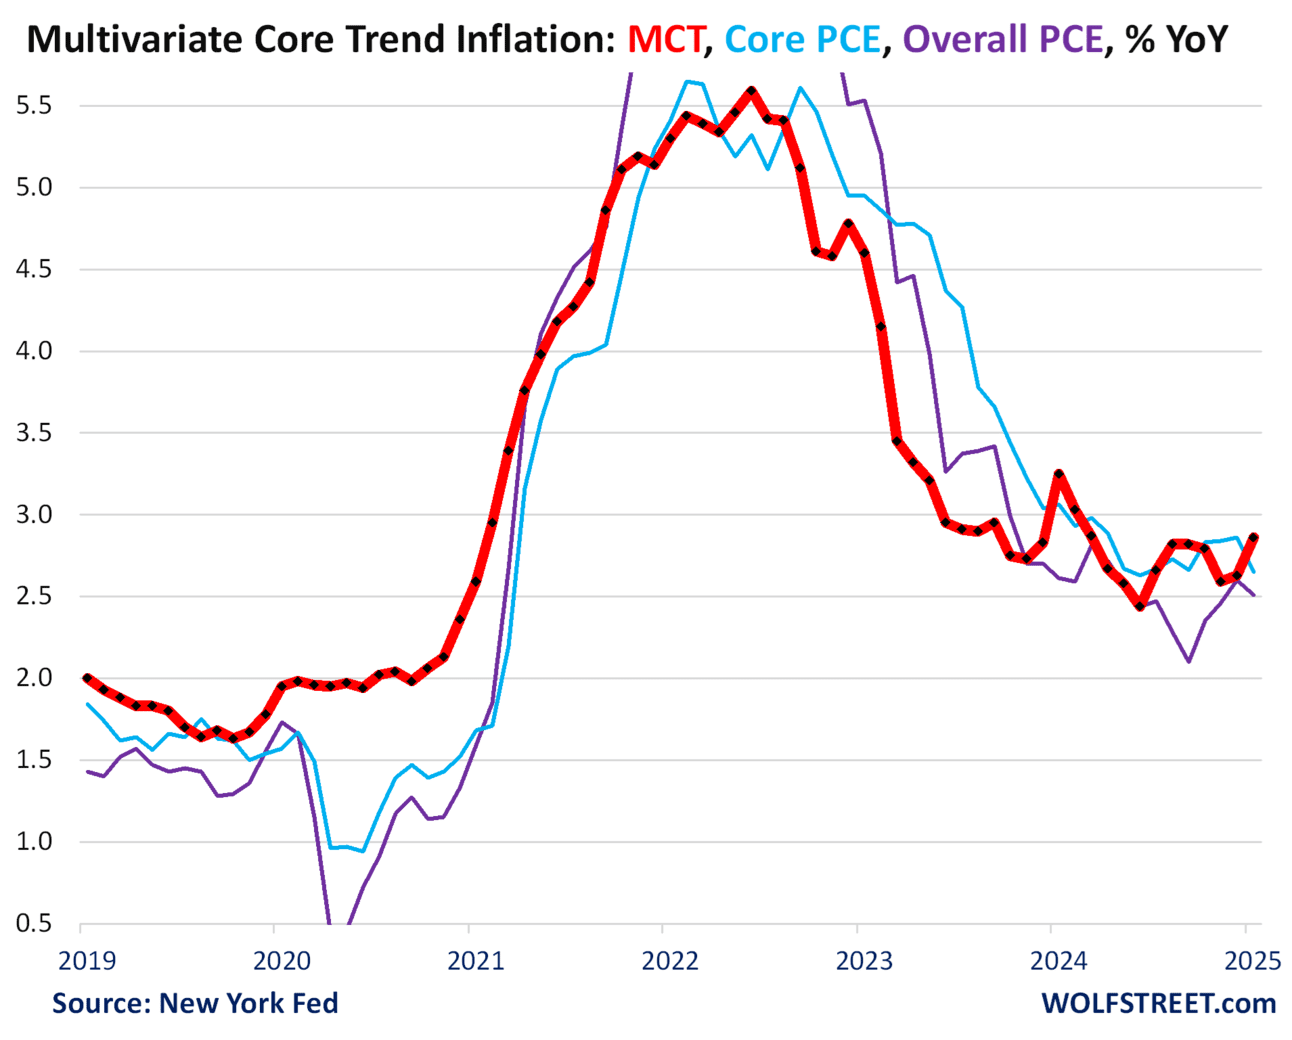
The New York Fed has developed what they believe to be a more accurate inflation measure called the Multivariate Core Trend Inflation. The latest update has inflation trending up quite strongly compared to the more traditional measures.
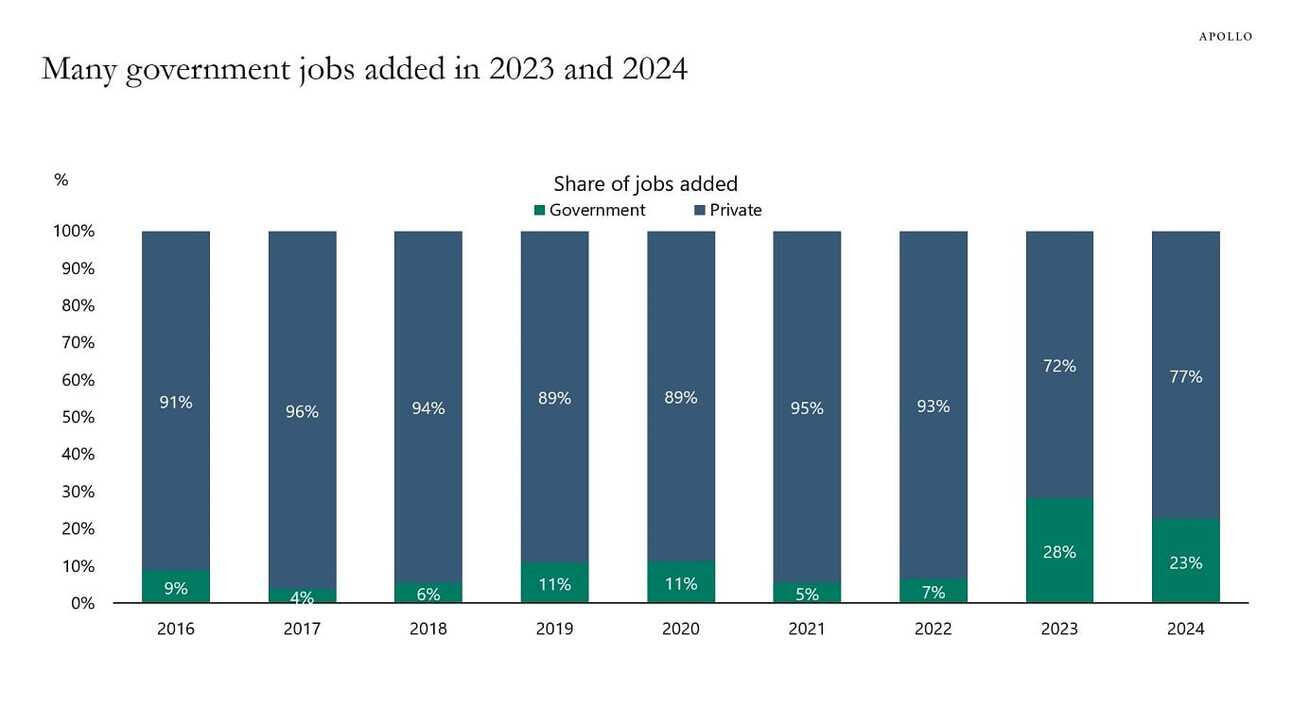
I think the current strength in the bond market is a complete overreaction to the DOGE highly public “successes.” Take a look at who the biggest job hirer was over the last 2 years. It kind of explains why the unemployment rate stayed so low with such anemic economic growth. This is super low-hanging fruit; I have no doubt Trump and Musk will sort this out ASAP. Probably better than anyone in history.
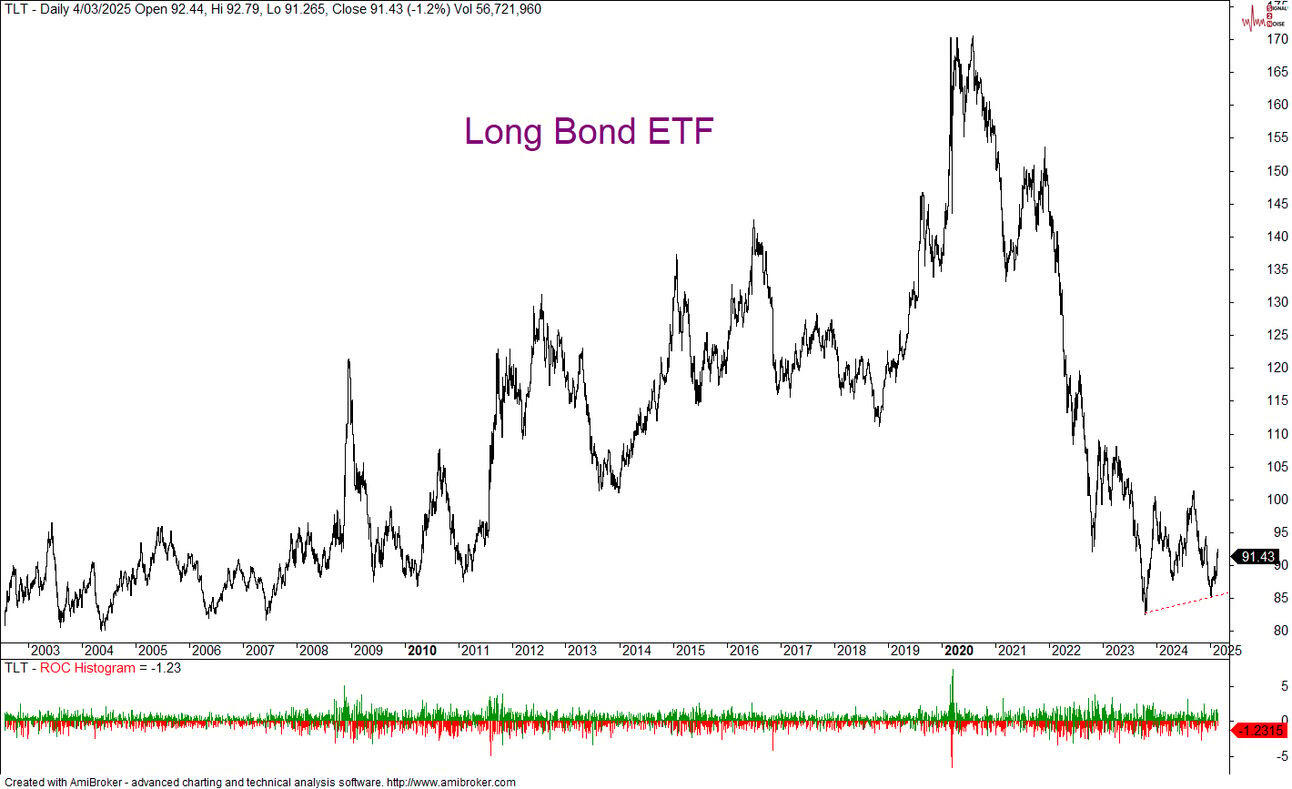
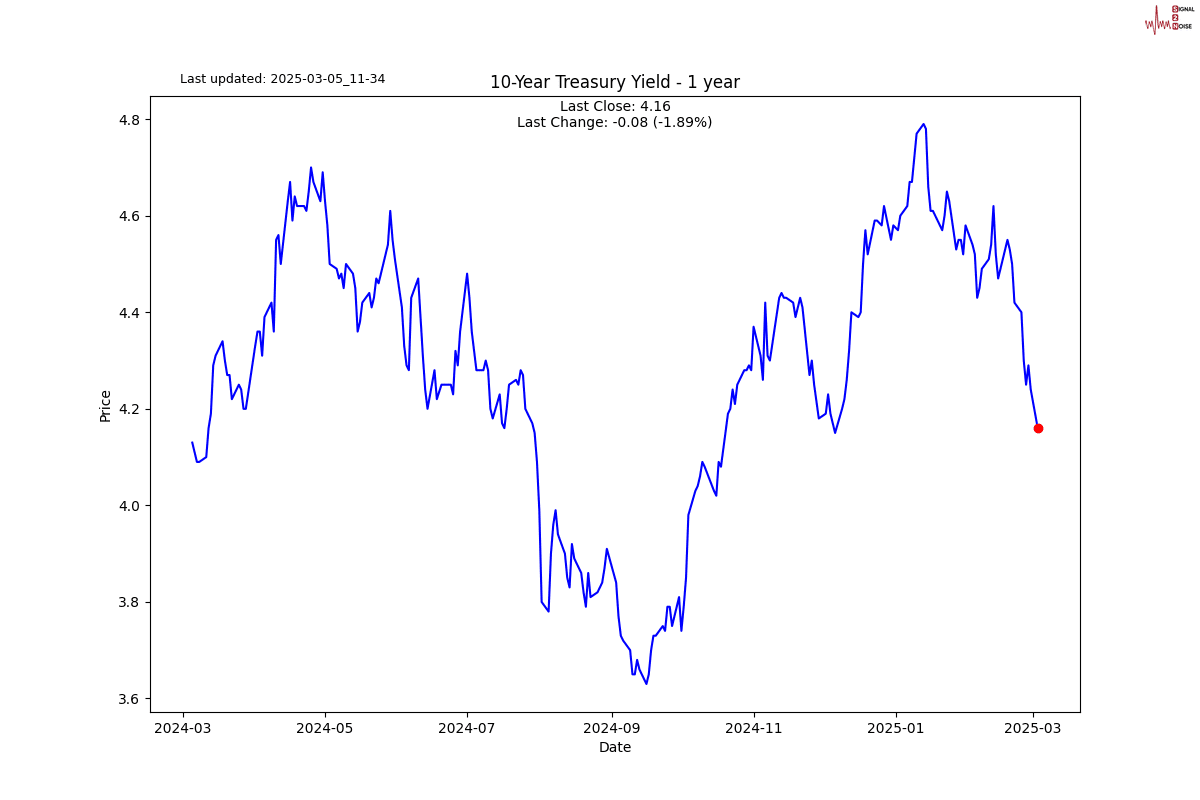
Back to my point on interest rates. Don’t lose sight of the big picture. When you look at the recent strength at the long end of the bond curve, you really have to struggle to see it. The US is sitting with a pile of debt that is going to put pressure on the bond market, and with inflation starting to reaccelerate, the three interest cuts being priced in are more optimistic than a biggest loser contestant visiting a McDonald's store for a salad and diet coke.
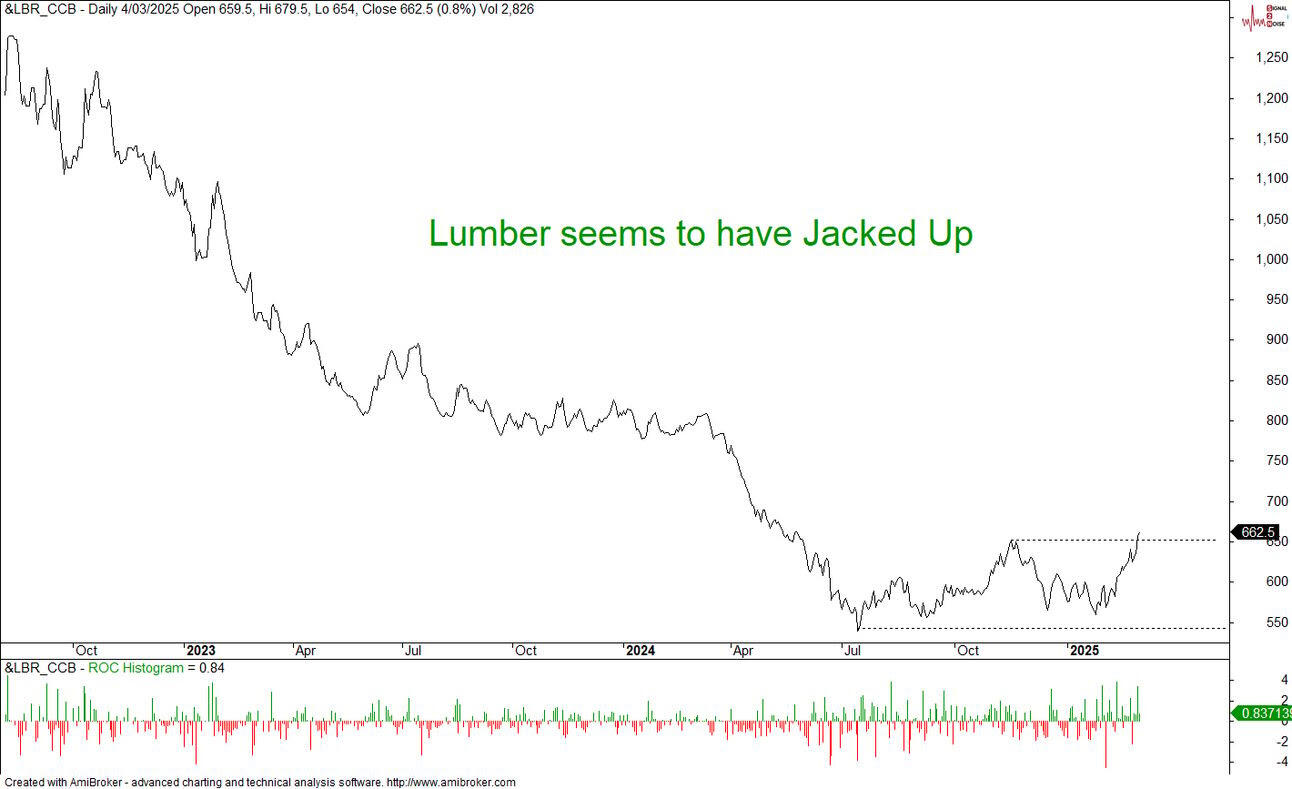
Speaking of inflation, Lumber just got off its jack. I know that was corny even I blushed.
S2N screener alert
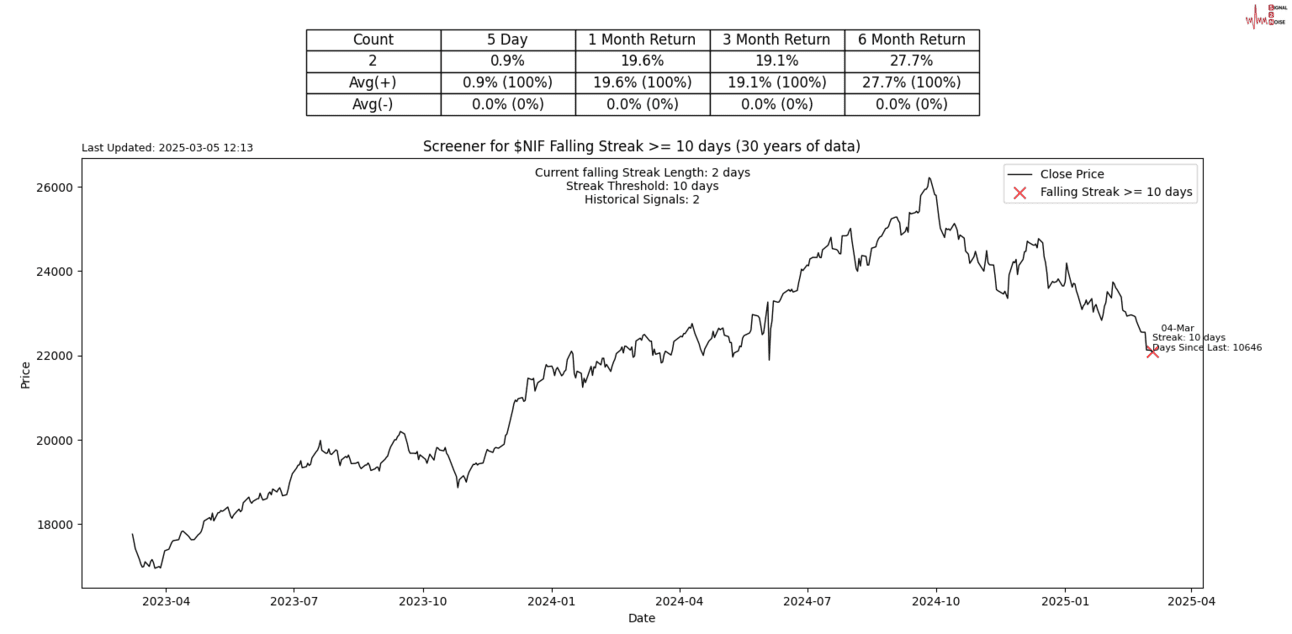
India’s NIFTY 50 is taking a break this year from last years incredible run. It is now down 10 days in a row for only the second time in the last 30 years.
S2N performance review

S2N chart gallery
S2N news today
Author

Michael Berman, PhD
Signal2Noise (S2N) News
Michael has decades of experience as a professional trader, hedge fund manager and incubator of emerging traders.


