How Elliott Wave mapped the CAD/JPY drop
In today’s blog post, we take a trip down memory lane and look back at a previous CADJPY analysis. This serves as a great example of how we use technical analysis to identify potential market moves.
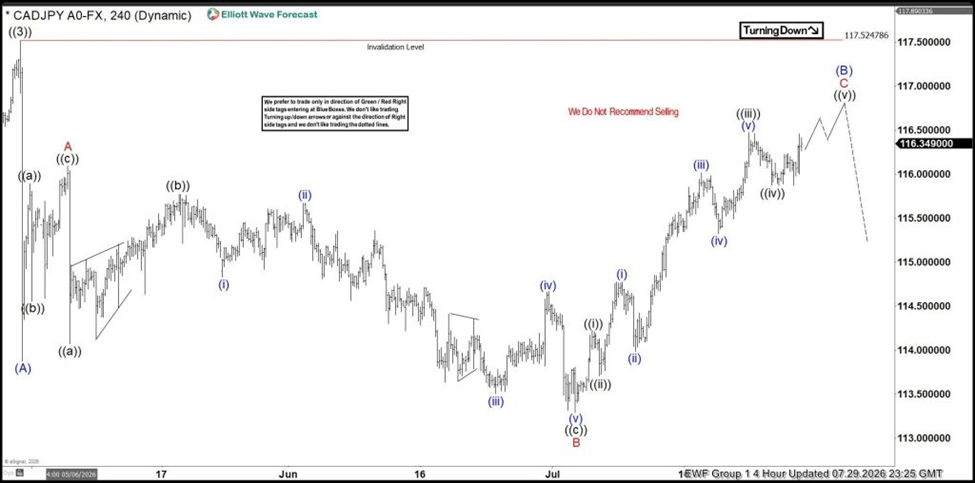
Specifically, we’ll be examining the CADJPY chart from 07.29.2026. At that time, we were tracking a potential bullish move. Our Elliott Wave analysis suggested that a primary wave (B) corrective pattern was nearing completion.
According to our forecast, we anticipated that CADJPY would form a significant high somewhere in the 117.52 region. This level represented a major Fibonacci resistance zone, and we believed it would be a logical place for the bulls to take profits and for the bears to re-enter the market.
The reaction: Sharp reversal from the highs
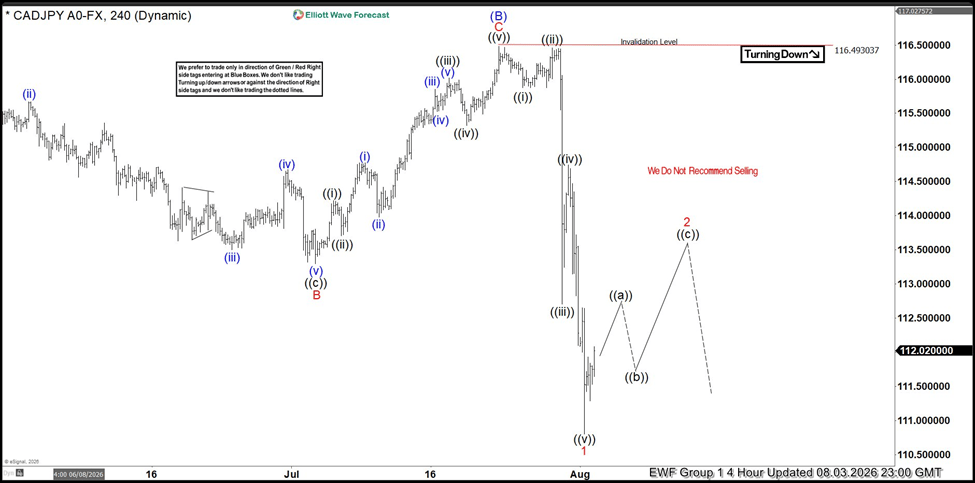
As anticipated, CADJPY capped its upward momentum right at the projected peak area and reversed aggressively to the downside. The pair completed wave ((v)) of C of (B) just below the 116.49 invalidation level, confirming the top before launching into a sharp impulsive decline.
This sell‑off drove prices more than 500 pips lower, reaching the 110.50 zone to complete wave 1, now trading around 112.02. The initial drop unfolded in five clear sub‑waves, underscoring the strength of the move.
Looking ahead, with wave 1 complete, the forecast calls for a corrective three‑wave bounce in wave 2—((a)), ((b)), and ((c))—toward the 113.50–114.00 region. Once this corrective rally is complete, the higher‑degree downtrend is expected to resume, extending the bearish sequence. Importantly, selling directly into current lows is not advised, as a corrective bounce is anticipated before the next major decline unfolds.
Conclusion
The CADJPY sequence is a textbook example of how Elliott Wave analysis maps out corrective structures and anticipates reversals. By combining wave counts, invalidation levels, and right‑side tags, traders can position themselves with the trend rather than against it.
Author

Elliott Wave Forecast Team
ElliottWave-Forecast.com

















