Gold multi-dimensional structural breakdown — Multi-tiered supply echelons

Executive summary
Spot Gold (XAU/USD) is currently executing a textbook structural distribution sequence within the proprietary SMAS 3D (Shved Market Analysis System) quantum framework. While lower intraday frames (M2–M15) reflect a localized relief bounce (+50% micro-pressure), the macro structure remains locked in a high-velocity downward momentum corridor (Structure Engine Slope: -43.9%).
Price is not operating in a vacuum. Above current levels ($4184.88), the market faces a heavily fortified 4-Tier Institutional Supply Hierarchy. Before even reaching the macro 8th-Order Super-Cluster (8TF) at $4300, buyers must first penetrate three successive intermediate supply massifs. The immediate collision with 1st-Echelon Supply (5TF) provides a high-conviction Trend-Continuation Short opportunity.
Multi-dimensional master analysis (XAU/USD H1)
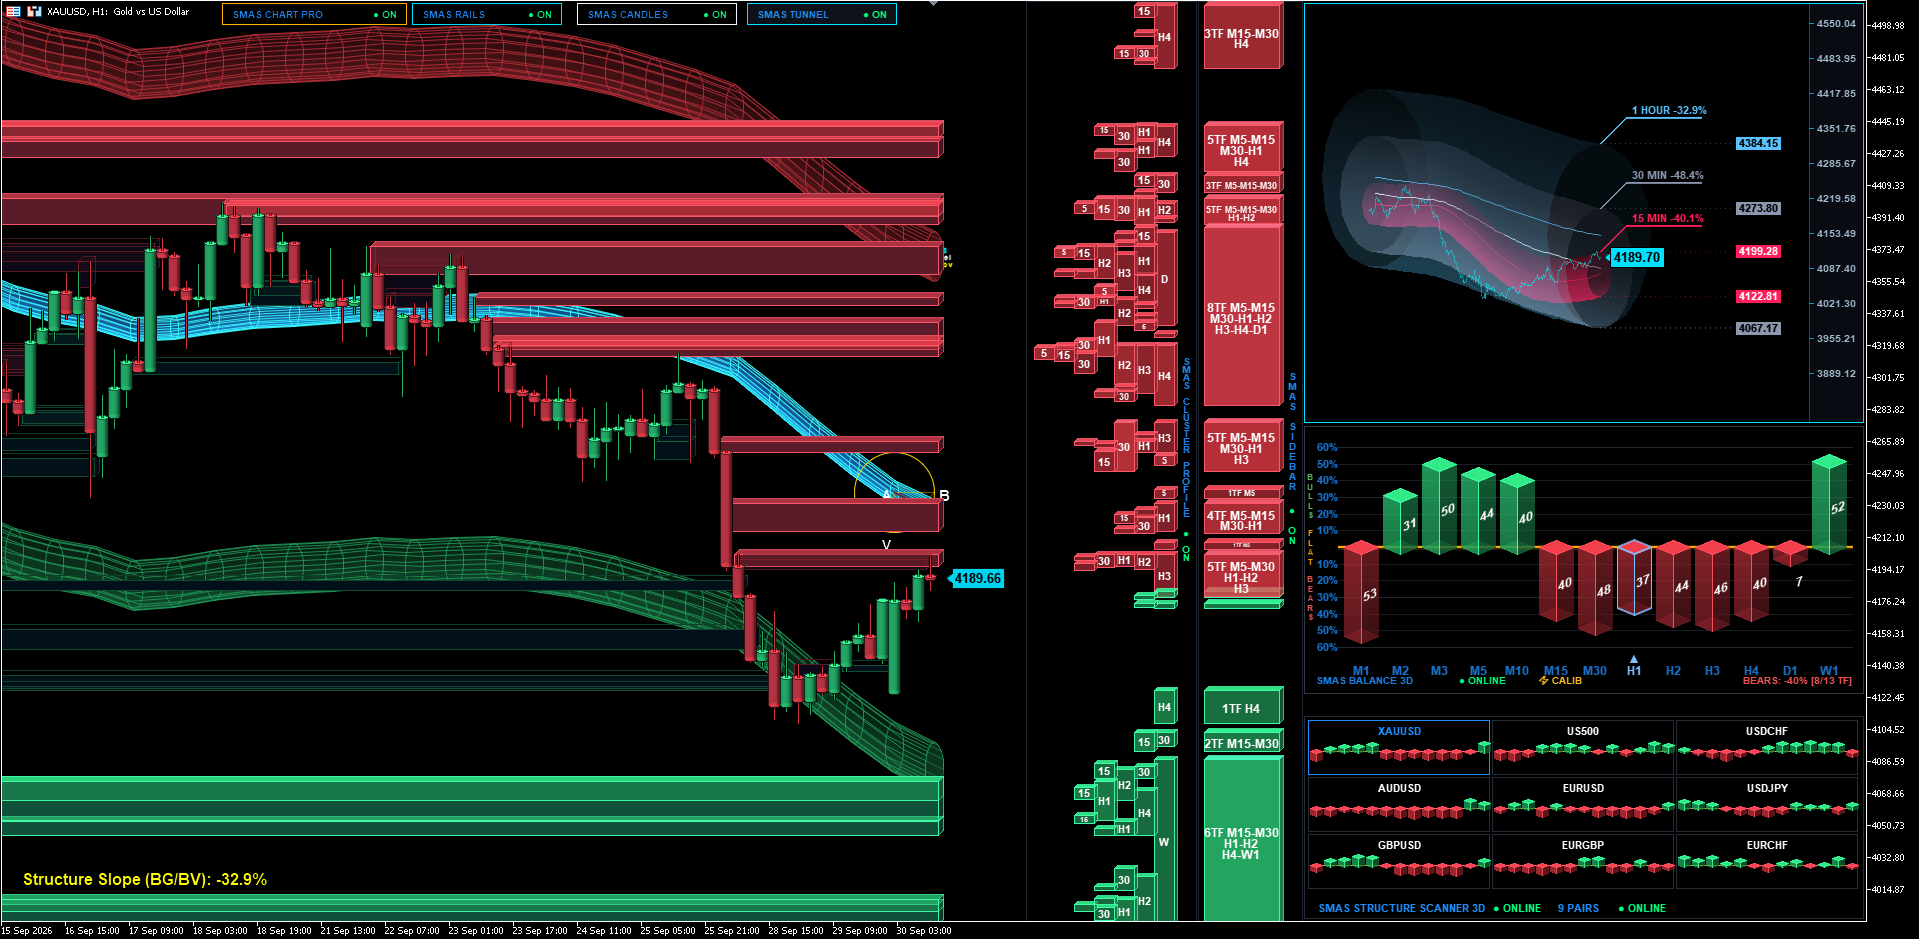
Decomposing the structural supply hierarchy on the Master Execution Chart (Figure 1):
The 4-Tier overhead supply defense (sidebar 3D):
- 1st Echelon (Immediate Battleground): 5TF Cluster (M5-M30-H1-H2-H3) in the 4195–4220 pocket, aligning with the 3D Tunnel central axis ($4185.25).
- 2nd Echelon (Tactical Barrier): 4TF Cluster (M5-M15-M30-H1) in the 4230–4250 zone.
- 3rd Echelon (Intermediate Massif): 5TF Cluster (M5-M15-M30-H1-H3) in the 4260–4280 zone.
- 4th Echelon (Strategic Super-Massif): 8TF Super-Cluster (M5-M15-M30-H1-H2-H3-H4-D1) capping the macro ceiling at 4300–4380.
Structure engine kinetic slope (-43.9%):
The ordinary least squares (OLS) regression axis confirms massive downward structural momentum across the 10-bar vector (Triangle A-B-V-G). The institutional center of mass is heavily tilted southward.
3D quantum volumetric tunnel projections:
Front-cap telemetry indicates triple-horizon negative velocity: 1H (-43.9%), 30M (-48.4%), and 15M (-40.1%), guiding price toward the lower terminal 2σ boundary at $4122 / $4067.
Phase Telemetry & Spring compression (structure balance 3D):
Macro horizons remain heavily dominated by sellers (BEARS -40% on H1–H4). The localized green spikes on M2 (+31%), M3 (+50%), and M5 (+44%) represent a temporary relief retracement directly into 1st-Echelon 5TF resistance.
Mathematical execution protocol (trend-continuation short)
Fading the relief rally at the 1st-Echelon 5TF Supply barrier in strict alignment with the -43.9% slope:
Parameter | Execution Coordinate | Structural Rationale |
Execution Setup | 1st-Echelon Supply Rejection | Shorting the exhaustion of the relief bounce into 5TF Supply Cluster |
Entry Zone (Short) | $4190.00 — $4210.00 | Retest of 5TF Supply (M5-M30-H1-H2-H3) & 3D Tunnel Central Axis |
Stop Loss (Invalidation) | $4235.00 | Above 1st-Echelon upper boundary / below 2nd Echelon (+35 pts risk) |
Take Profit 1 (50% Volume) | $4122.00 | Lower 2σ boundary of 3D Quantum Tunnel (+780 pts / Move SL to BE) |
Take Profit 2 (Macro Target) | $4067.00 | Terminal institutional demand floor of the macro 3D shell (+1330 pts) |
Asymmetric Risk / Reward | 1 : 5.8 | High-Alpha Trend Continuation Setup |
Author

Andrey Shvedov
SMAS Quantum Research
Andrey Shvedov is an active quantitative trader, software architect, and financial market researcher with over 24 years of live market microstructure experience.

















