How do you trade forex with a session map?

Experienced stock market traders often attempt to apply their battle-tested systems to forex trading. They often suffer the same setbacks as aspiring forex traders when they do so. Why is this? What makes the forex market so different from stocks, bonds, or indices?
One key difference is that the forex market trades continuously, 24 hours a day, five days a week. This continuous action (but fluctuating in intensity) means new participants must adjust their trading style. Strategies that worked in other markets need to be tweaked to tackle FX successfully.
Everything is relative to the time of the day in which you are trading in FX markets. Trades made when Tokyo traders are active can be quite different from trades made when London or New York traders are active. So, how can traders break down the 24-hour cycle without exchange-mandated hours?
Enter session maps.
Trading different money centres
A clever way to manage the 24-hour action in forex is to break down each day into the three major "sessions" that occur in each trading day.
- The Asia/Pacific session:
Most turnover in this time zone is done in Sydney, Tokyo, Hong Kong, and Singapore. Typically, there will be exporters and regional central banks active during this session. However, the liquidity is nowhere near as deep as it is during the London or New York sessions. As such, the price action is not usually as interesting as it is during the other sessions.
The Asia session does have its moments: when there is regional data (AUD or NZ unemployment, JPN Tankan, Central Bank meetings), you can rely on strong directional moves. But most of the time, this session is range-bound or follows whatever happened in the New York session.
- The London session:
This is perhaps the most important session of the day, for geographical reasons above all else. Along with London, other European financial centres like Frankfurt, Geneva, and Paris are active. That's why sizeable corporate activity takes place during this session and contributes to the deep liquidity of the session. This deep liquidity means that the price action seen during the London session is quite important. It gives a good insight into market sentiment and positioning.
- The New York session:
The forex market experiences its peak in turnover as London passes the baton onto New York. However, whereas the London session tends to be trendy, New York can have much more volatility and chop. During the afternoon in New York, liquidity starts to dry up quickly.
How do you trade forex with a session map?
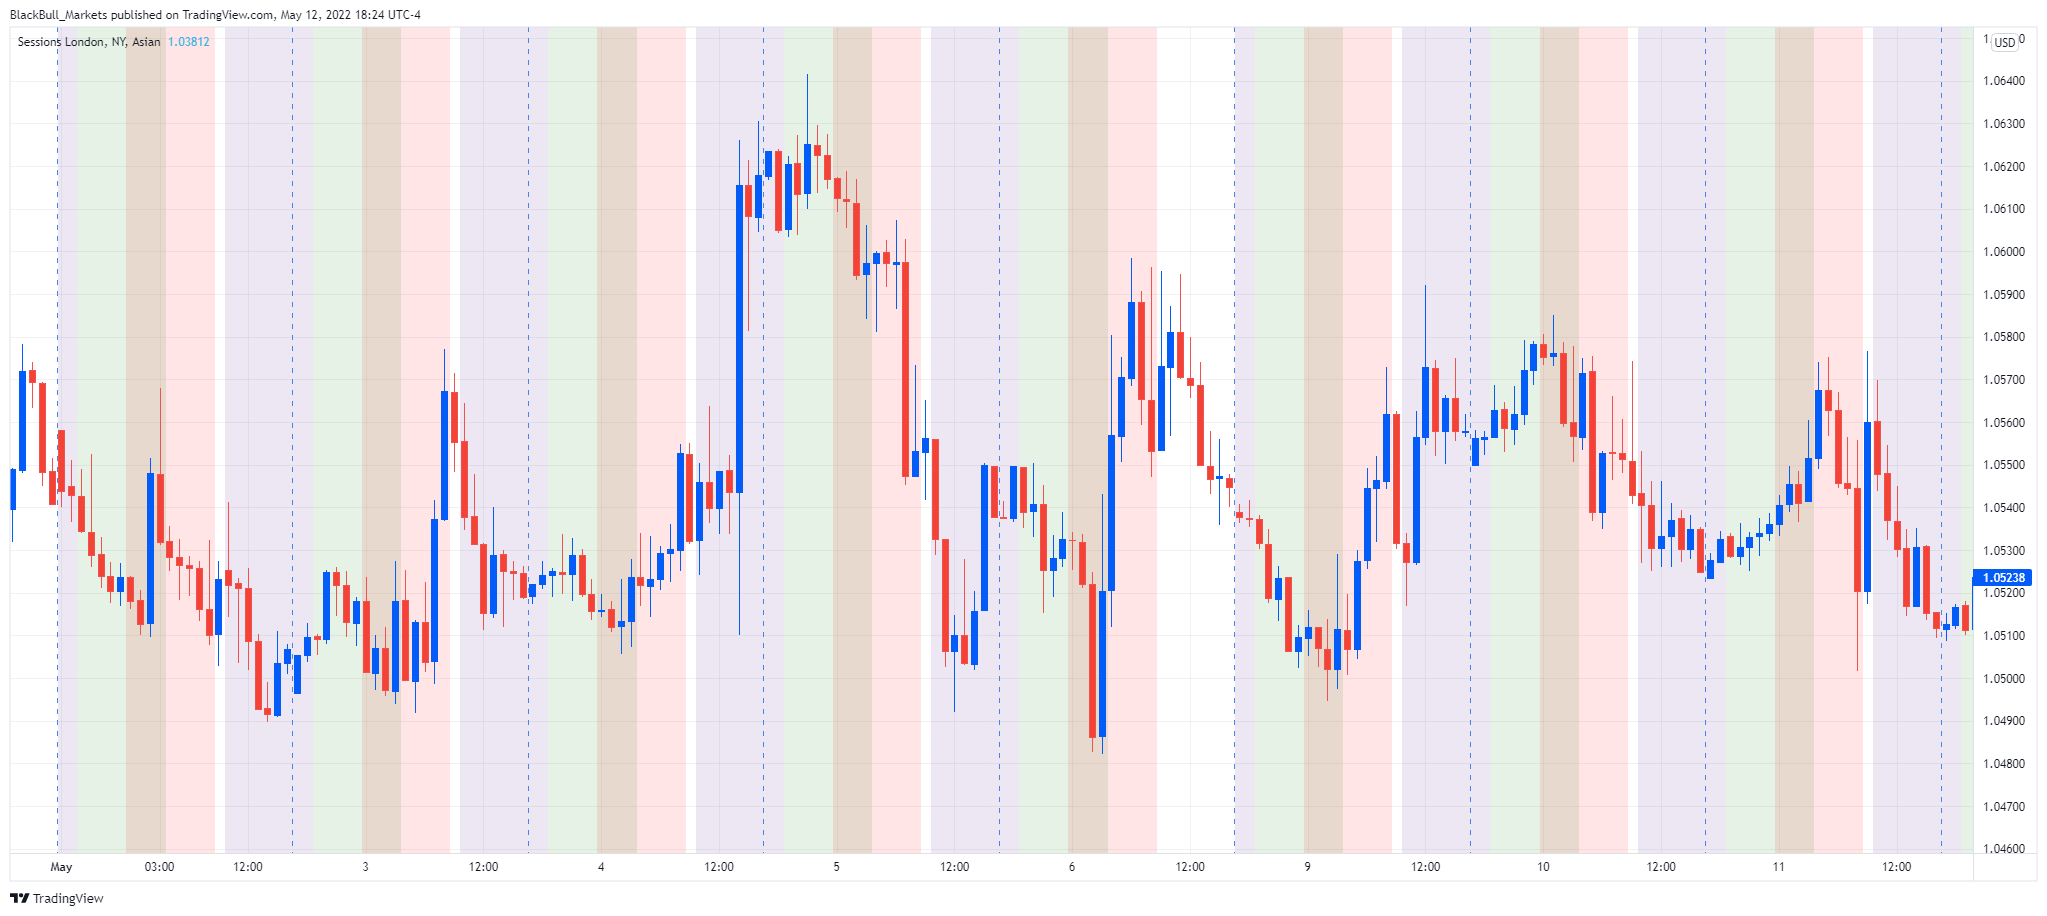
Figure 1. EURUSD 1H with Session NY, London, Asian indicator
Evidently, the best trading strategies to deploy can change significantly depending on the time in which you are trading.
The primary goal of a session map is to help traders visualise which session is currently operational.
The session map allows traders to spot strengths and weaknesses during a session more efficiently. They also help you notice patterns which can be helpful in identifying market sentiment.
• Are all the majors trending in the same direction? Perhaps the American Dollar is pulling everything in the same direction, or maybe risk appetite is driving high-yield currencies higher (or lower).
• Is it a USD-dynamic, with EUR/USD, GBP/USD, AUD/USD, and NZD/USD going one way and USD/CAD and USD/CHF going the other way?
• Is it a commodity-dollar day, with big moves in AUD/USD and USD/CAD?
The session map can help you establish these factors with greater ease. Indicators for session maps are plentiful and can be found on all major trading platforms. The session map visualised above is one of the most popular indicators used by traders on TradingView. In this indicator, each colour represents a different session (Asian = purple, London = green, New York = red). Overlap between the London and New York session creates a brown band.
Author

Mark O’Donnell
Blackbull Markets Limited
Mark O’Donnell is a Research Analyst with BlackBull Markets in Auckland, New Zealand.


