Housing Consistent With a Recession in 2020

Over the past year, 4 housing indicators have moved in ways consistent with patterns seen in 3 previous recessions.
Housing is Signaling a Recession
Despite optimistic talk from Fed regional presidents, a St. Louis Fed study concludes Housing Indicators Remain Consistent With a Broader Slowdown in 2020.
Key Takeaways
- Over the past year, four housing indicators have moved in ways consistent with patterns seen before three previous recessions.
- These indicators are mortgage rates, existing home sales, real house prices and the momentum of residential investment.
- More recent housing data still point to a slowdown, albeit a less severe one.
1: 30-Year Fixed Mortgage Rates
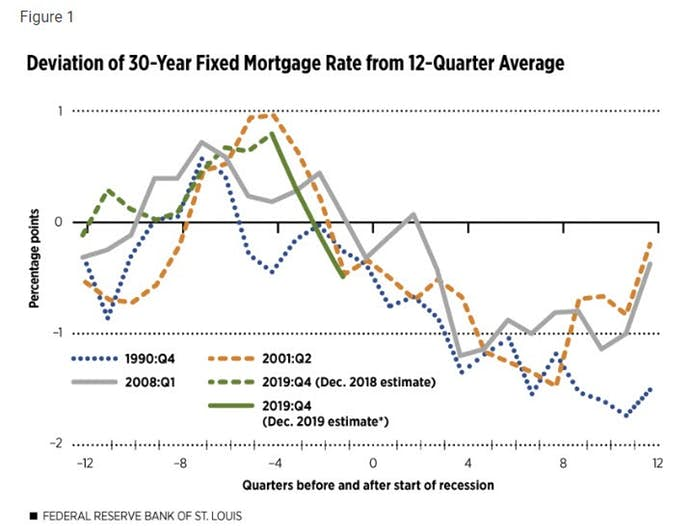
NOTES: The figure shows the average quarterly 30-year fixed mortgage rate minus the average of the previous three years (12 quarters). Each line shows three years of data before and after a recession; time zero is the quarter in which a recession began. The first quarter of the recession is indicated in the line label (key): the fourth quarter of 1990, second quarter of 2001 and first quarter of 2008.
Consistent with earlier cycles, the average 30-year fixed mortgage rate has declined significantly even though a recession has not begun. Figure 1 updates the path of this long-term mortgage rate through the third quarter of 2019.2 The last observation of about one-half of one percentage point below the most recent three-year moving average is identical to the level one quarter before the onset of the 2001 recession and is just below the level one quarter before the 1990-91 recession. Hence, this indicator remains consistent with—though still does not guarantee—an imminent recession.
2: Existing Home Sales
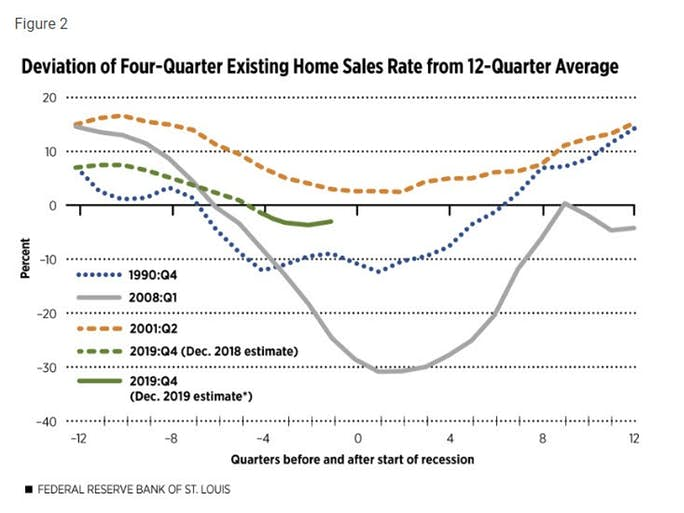
NOTES: The figure shows the percent difference between the current rate of existing single-family home sales (four-quarter average) and the average annualized sales rate during the previous three years (12 quarters).
The pace of existing home sales relative to their recent trend rate continued to slow during 2019. (See Figure 2.) Despite a modest upturn in the third quarter of 2019, this indicator remains firmly in the range observed prior to the 1990-91 and 2001 recessions. In contrast to the Great Recession, the decline in home sales since dipping below zero has been much more moderate.
3: Real House Prices
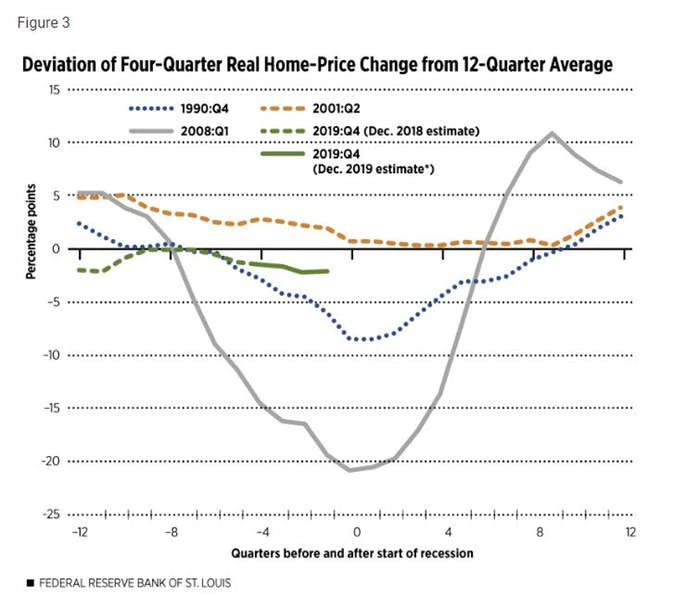
NOTES: The figure shows the four-quarter percent change in the CoreLogic Home Price Index, deflated by the Personal Consumption Expenditures (PCE) Chain-Weighted Price Index, minus the annualized percent change during the previous three years (12 quarters).
Qualitatively, the recent behavior of inflation-adjusted home-price growth relative to its recent trend rate (shown in Figure 3) is very similar to the patterns of the two previous indicators—that is, it mirrors the run-up to the relatively mild 1990-91 and 2001 recessions and is unlike the pattern just before the Great Recession.
4: Contribution of Residential Investment to GDP Growth
NOTES: The figure shows the four-quarter average contribution to real GDP growth minus the annualized contribution during the previous three years (12 quarters).
If any of the highlighted housing indicators hints at a departure from the typical recessionary pattern it is the contribution of residential investment to GDP growth. (See Figure 4.) Despite some improvement over the course of 2019, residential investment continued to be a drag on economic growth through the third quarter, albeit a slightly smaller one than before. Of all four indicators, this one most closely resembles the patterns seen before the two relatively mild recessions of 1990-91 and 2001 versus the more severe Great Recession.
Conclusion: Housing Indicators Still Signal Recession, Albeit a Less Severe One
The value of leading indicators—from housing variables to the slope of the yield curve—is that they offer an opportunity to prepare for a possible economic slowdown or outright downturn. A recent example is the Federal Reserve’s dramatic turn from a program of monetary tightening in 2018 to an easing of policy in 2019.
One hazard of leading indicators is that they can lead to misinterpretation and complacency. If the economic slowdown signaled by weakening housing indicators and some portions of the U.S. Treasury yield curve inverting in 2019 does not begin immediately, some observers may think the precautions undertaken in response to the signals, such as the Fed’s recent easing of monetary policy, can void the signals themselves and pre-empt a recession.
This would run counter to the historical patterns documented in this article: The Fed eased monetary policy and mortgage rates plunged in advance of each of the three previous recessions, yet the economy still went into a downturn. Thus, the value of leading indicators may lie more in their role as early warning signals that help us better prepare for, rather than outright prevent, a recession.
This time could be different, however, if the Fed’s timely interest rate cuts and other factors in fact help to prevent a recession in late 2019 or 2020. If that happens, we should re-examine the indicators that have been successful in signaling recessions in the past. In the meantime, we should not dismiss their salience.
Why Are Interest Rates Down?
This is certainly an interesting study and runs in sharp contrast to recent Fed statements that the economy is sound.
It also in contrast to those who suggest lower interest rate will revive housing.
Rather, rates are down precisely because the economy is weakening.
Service Sector Expansion
Earlier today I reported ISM Service Index Up, 11 Sectors Expanding, 6 Contracting.
But Guess What: Real Estate and Rental & Leasing are two of the sectors in contraction.
New Home Sales Badly Miss Expectations
On December 23, I reported New Home Sales Badly Miss Expectations
New home sales rose 1.3% in November but only because of huge downward revisions.
And here's another Guess What: The St Louis Fed Study came out a week before that massive downward revision in new home sales.
Manufacturing
Also on December 23, I reported Economists Wrong on Durable Goods By an Amazing 3.9 Percentage Points.
Nine States in or Near Contraction
And please note that a Philadelphia Fed study projects Nine States Projected to Contract in 2020
Mideast tensions cannot possibly help.
So why would it stop at nine?
Other than that, everything is just dandy except of course leverage, hedge fund record long bets on S&P 500 futures, valuations through the roof, a huge slowdown in Germany, capital controls in China, and a big signal from gold that something is very wrong.
This article belongs to the 20 trading ideas for 2020 series. Check the full list of 2020 pieces.
Author

Mike “Mish” Shedlock's
Sitka Pacific Capital Management,Llc
Mike “Mish” Shedlock is a registered investment advisor for SitkaPacific Capital Management.


