House Votes Today

Good Morning Traders,
As of this writing 4 AM EST, here’s what we see:
US Dollar: Jun. USD is Up at 99.530.
Energies: May Crude is Up at 48.31.
Financials: The June 30 year bond is Down 4 ticks and trading at 150.21.
Indices: The June S&P 500 emini ES contract is 13 ticks Higher and trading at 2345.75.
Gold: The April gold contract is trading Down at 1247.10. Gold is 26 ticks Lower than its close.
Initial Conclusion
This is not a correlated market. The dollar is Up+ and crude is Up+ which is not normal but the 30 year bond is trading Lower. The Financials should always correlate with the US dollar such that if the dollar is lower then bonds should follow and vice-versa. The indices are Up and Crude is trading Up which is not correlated. Gold is trading Down which is correlated with the US dollar trading Up. I tend to believe that Gold has an inverse relationship with the US Dollar as when the US Dollar is down, Gold tends to rise in value and vice-versa. Think of it as a seesaw, when one is up the other should be down. I point this out to you to make you aware that when we don’t have a correlated market, it means something is wrong. As traders you need to be aware of this and proceed with your eyes wide open.
Asia traded mainly Higher with the exception of the Aussie and Hang Seng exchanges which traded Lower. Currently Europe is mixed.
Possible Challenges To Traders Today
– Unemployment Claims are out at 8:30 AM EST. This is major.
– Chair Yellen Speaks at 8:45 AM. This is major.
– New Home Sales are out at 10 AM EST. This is major.
– Nat Gas Storage is out at 10:30 AM EST. This is major.
– FOMC Member Kashkari Speaks at 12:30 PM EST. This is major.
Treasuries
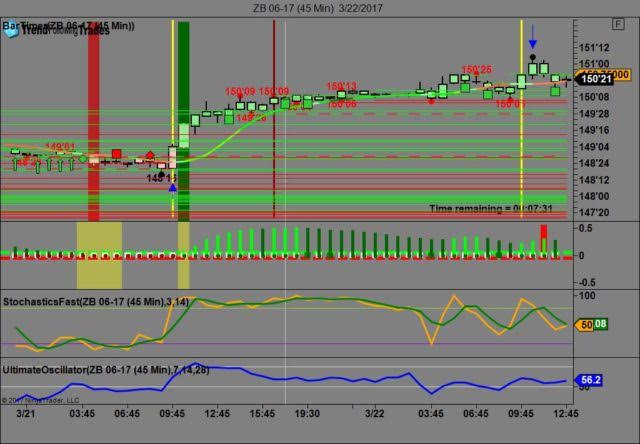
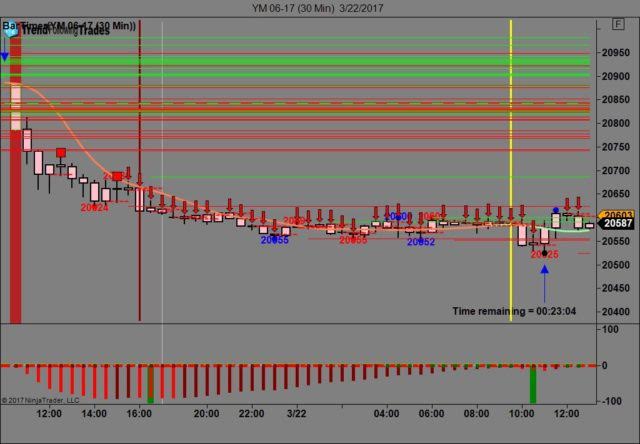
We’ve elected to switch gears a bit and show correlation between the 30 year bond (ZB) and The YM futures contract. The YM contract is the DJIA and the purpose is to show reverse correlation between the two instruments. Remember it’s liken to a seesaw, when up goes up the other should go down and vice versa.
Yesterday the ZB made it’s move at around 11 AM with no real economic news to speak of. The ZB hit a high at around that time and the YM hit a low. If you look at the charts below ZB gave a signal at around 11 AM and the YM was moving higher at the same time. Look at the charts below and you’ll see a pattern for both assets. ZB hit a high at around 11 AM and the YM hit a low. These charts represent the newest version of Trend Following Trades and I’ve changed the timeframe to a 30 minute chart to display better. This represented a shorting opportunity on the 30 year bond, as a trader you could have netted about 20 plus ticks per contract on this trade. Each tick is worth $31.25. We added a Donchian Channel to the charts to show the signals more clearly.
Charts Courtesy of Trend Following Trades built on a NinjaTrader platform Click on an image to enlarge it.
Bias
Yesterday we gave the markets a downside bias as both the Bonds and Gold were trading higher. The Dow dropped 7 points but the S&P and Nasdaq gained slightly. Today we aren’t dealing with a correlated market and our bias is to the upside.
Could this change? Of Course. Remember anything can happen in a volatile market.
Commentary
Yesterday we gave the markets a downside bias and the Dow dropped as we saw a continuation of Tuesday’s drop. As we stated previously the markets don’t like uncertainty and today promises much more uncertainty as the House votes on the American Health Care Act or the GOP’s answer to to repealing Obamacare. The House GOP must have a minimum of 216 votes to move this bill to the Senate. At last count they were short about 25 but this is changing by the minute as President Trump is adamant about getting this bill passed regardless of it being inadequate for most Americans. The President is browbeating Republicans into voting for the bill and has told some of them that he’s going to come after them if they don’t. Time will tell how this all works out.
Author

Nick Mastrandrea
Market Tea Leaves


