Hormuz traffic surges 400% as Iran’s Oil cargoes dry up

Traffic through the Strait of Hormuz has jumped by almost 400% in two weeks, with nearly 200 ships navigating the Strait last week. That’s up from around 150 the week before, and just 40 two weeks earlier.
At first glance, this sounds like the Hormuz situation is finally starting to soften.
But there’s a bit of a contradiction here.
Iran’s own oil shipments to Asia have now almost dried up, even before the US announces its latest round of sanctions against Tehran. Loaded Iranian vessels are reportedly getting trapped inside the Gulf, while empty tankers are struggling to get in, and the cost of those cargoes has jumped to its highest level in years.
Iran’s central bank governor even said last week that the country’s crude exports have “virtually stopped”.
So while more ships are getting through the Strait, that does not necessarily mean Iran’s oil exports, or the wider oil market, are returning to normal.
And that makes the WTI chart quite interesting, because technically, oil is still in a local uptrend.
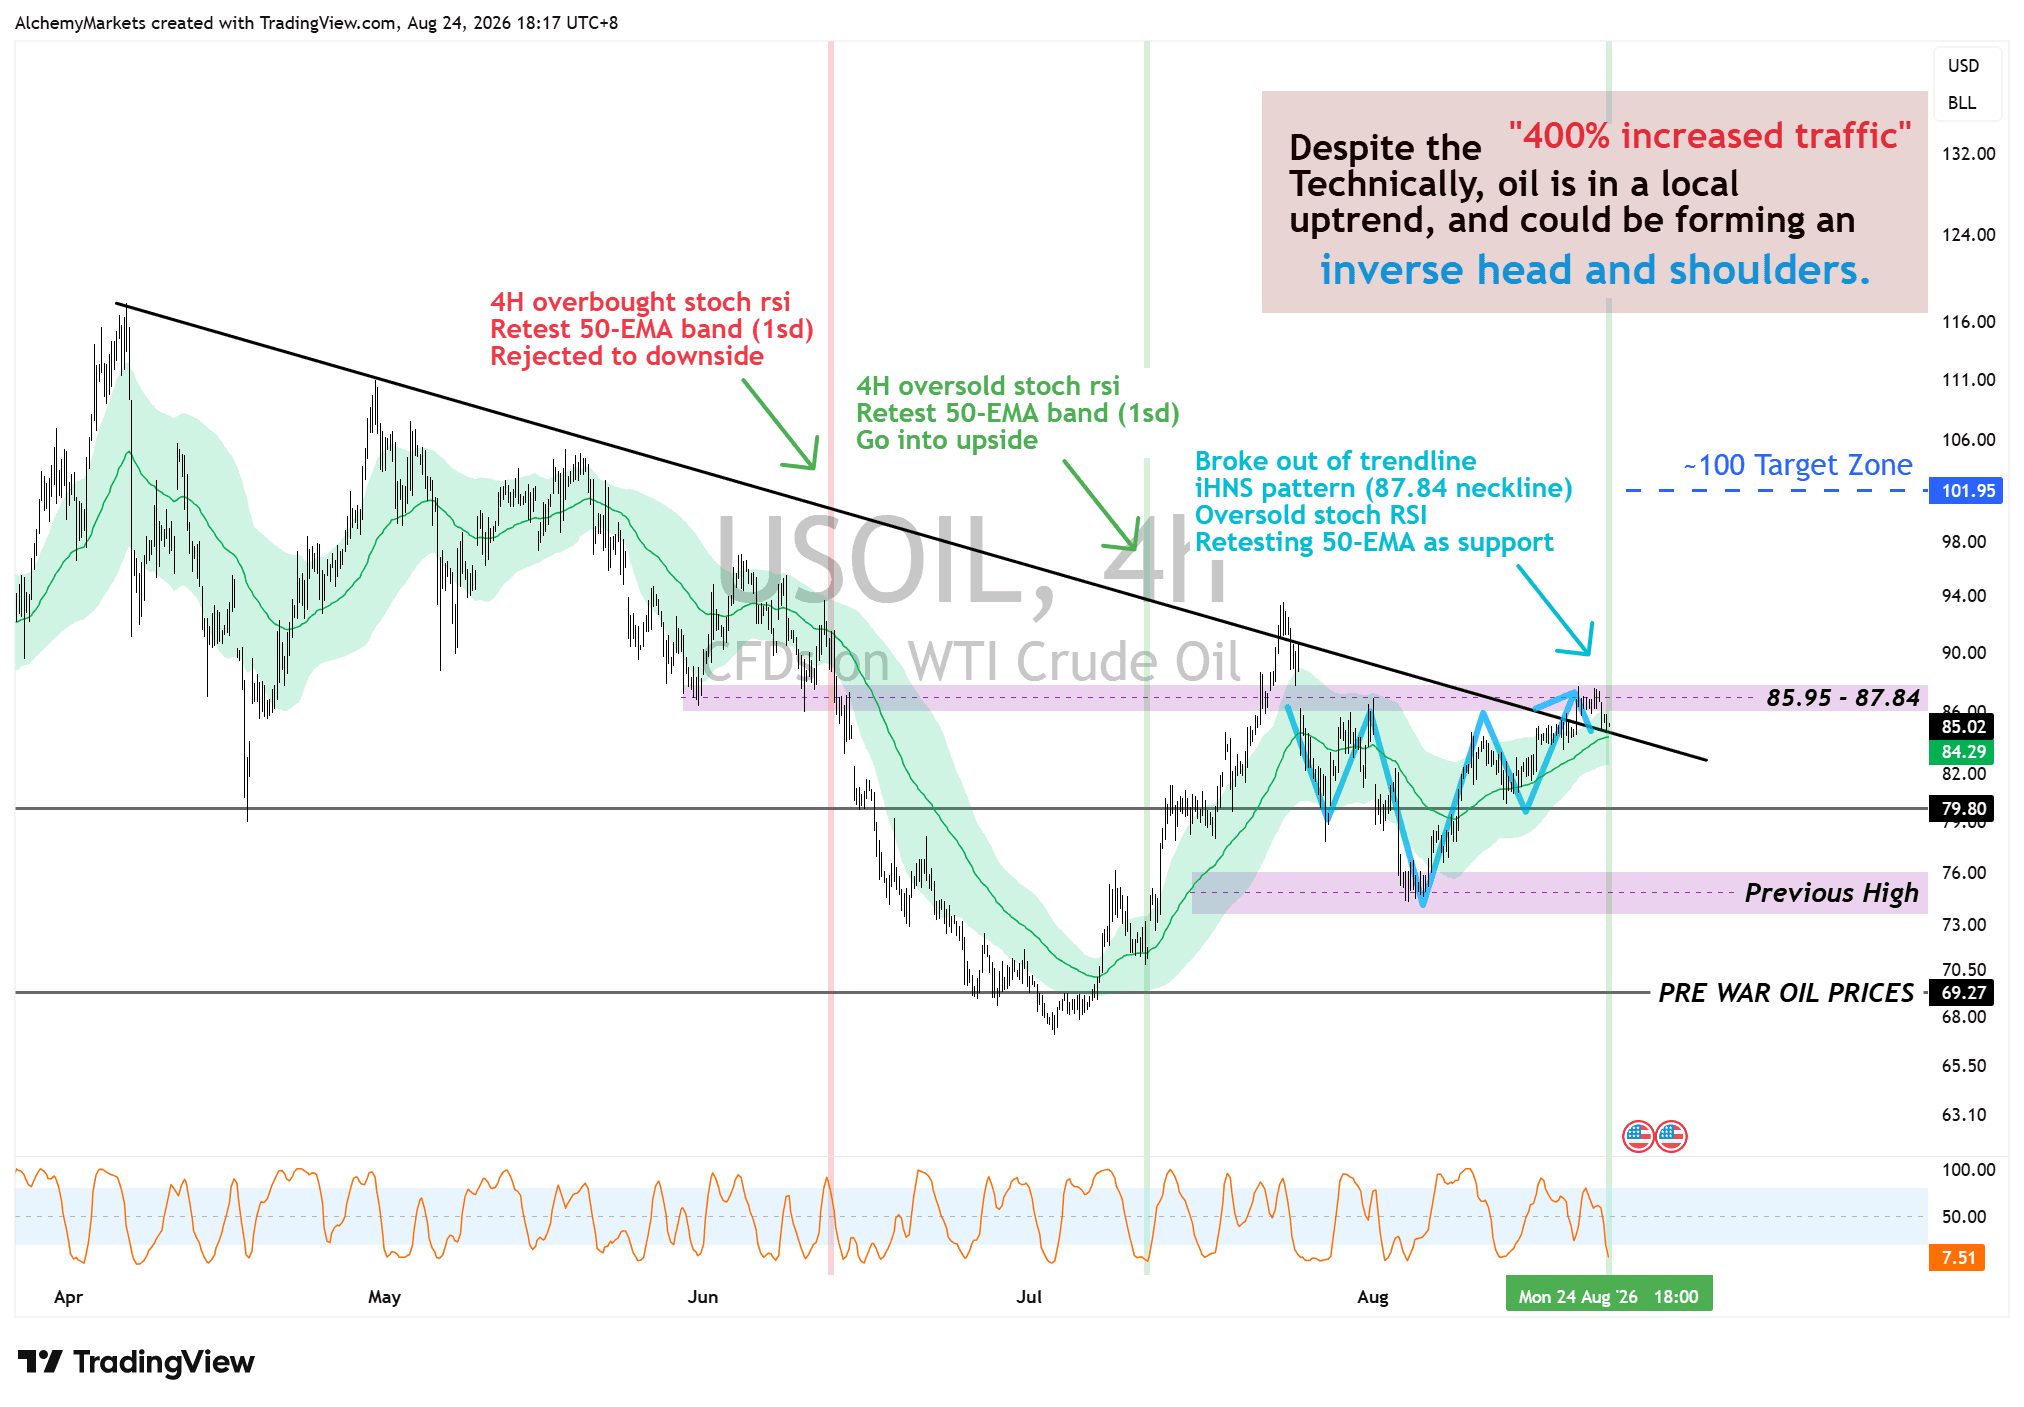
WTI has broken through the descending trendline we’ve been tracking, and price is now retesting the 4H 50-EMA band after the Stochastic RSI moved back into oversold territory.
There is also a possible inverse head-and-shoulders forming here, with the neckline around 85.95–87.84.
If the 50-EMA band continues to act as support, and WTI can properly break through that neckline, the measured move points towards roughly the $100 area.
That’s what I’ll be watching over the next few days.
- If Hormuz really is softening, does oil finally start breaking lower?
- Or does WTI hold the local uptrend despite more traffic getting through the Strait?
Elsewhere, equities have been remarkably calm.
The VIX has now been sitting in extreme low-volatility territory for 17 days straight.
This typically means investors are either ultra-bullish, or getting quite complacent at the moment.
While this alone isn’t a strong timing indicator, equities can obviously just keep grinding higher when volatility stays this low.
But when we pair it with the logarithmic S&P 500 channel we’ve been tracking for a while, I do think it fires off a warning signal for long-side investors.
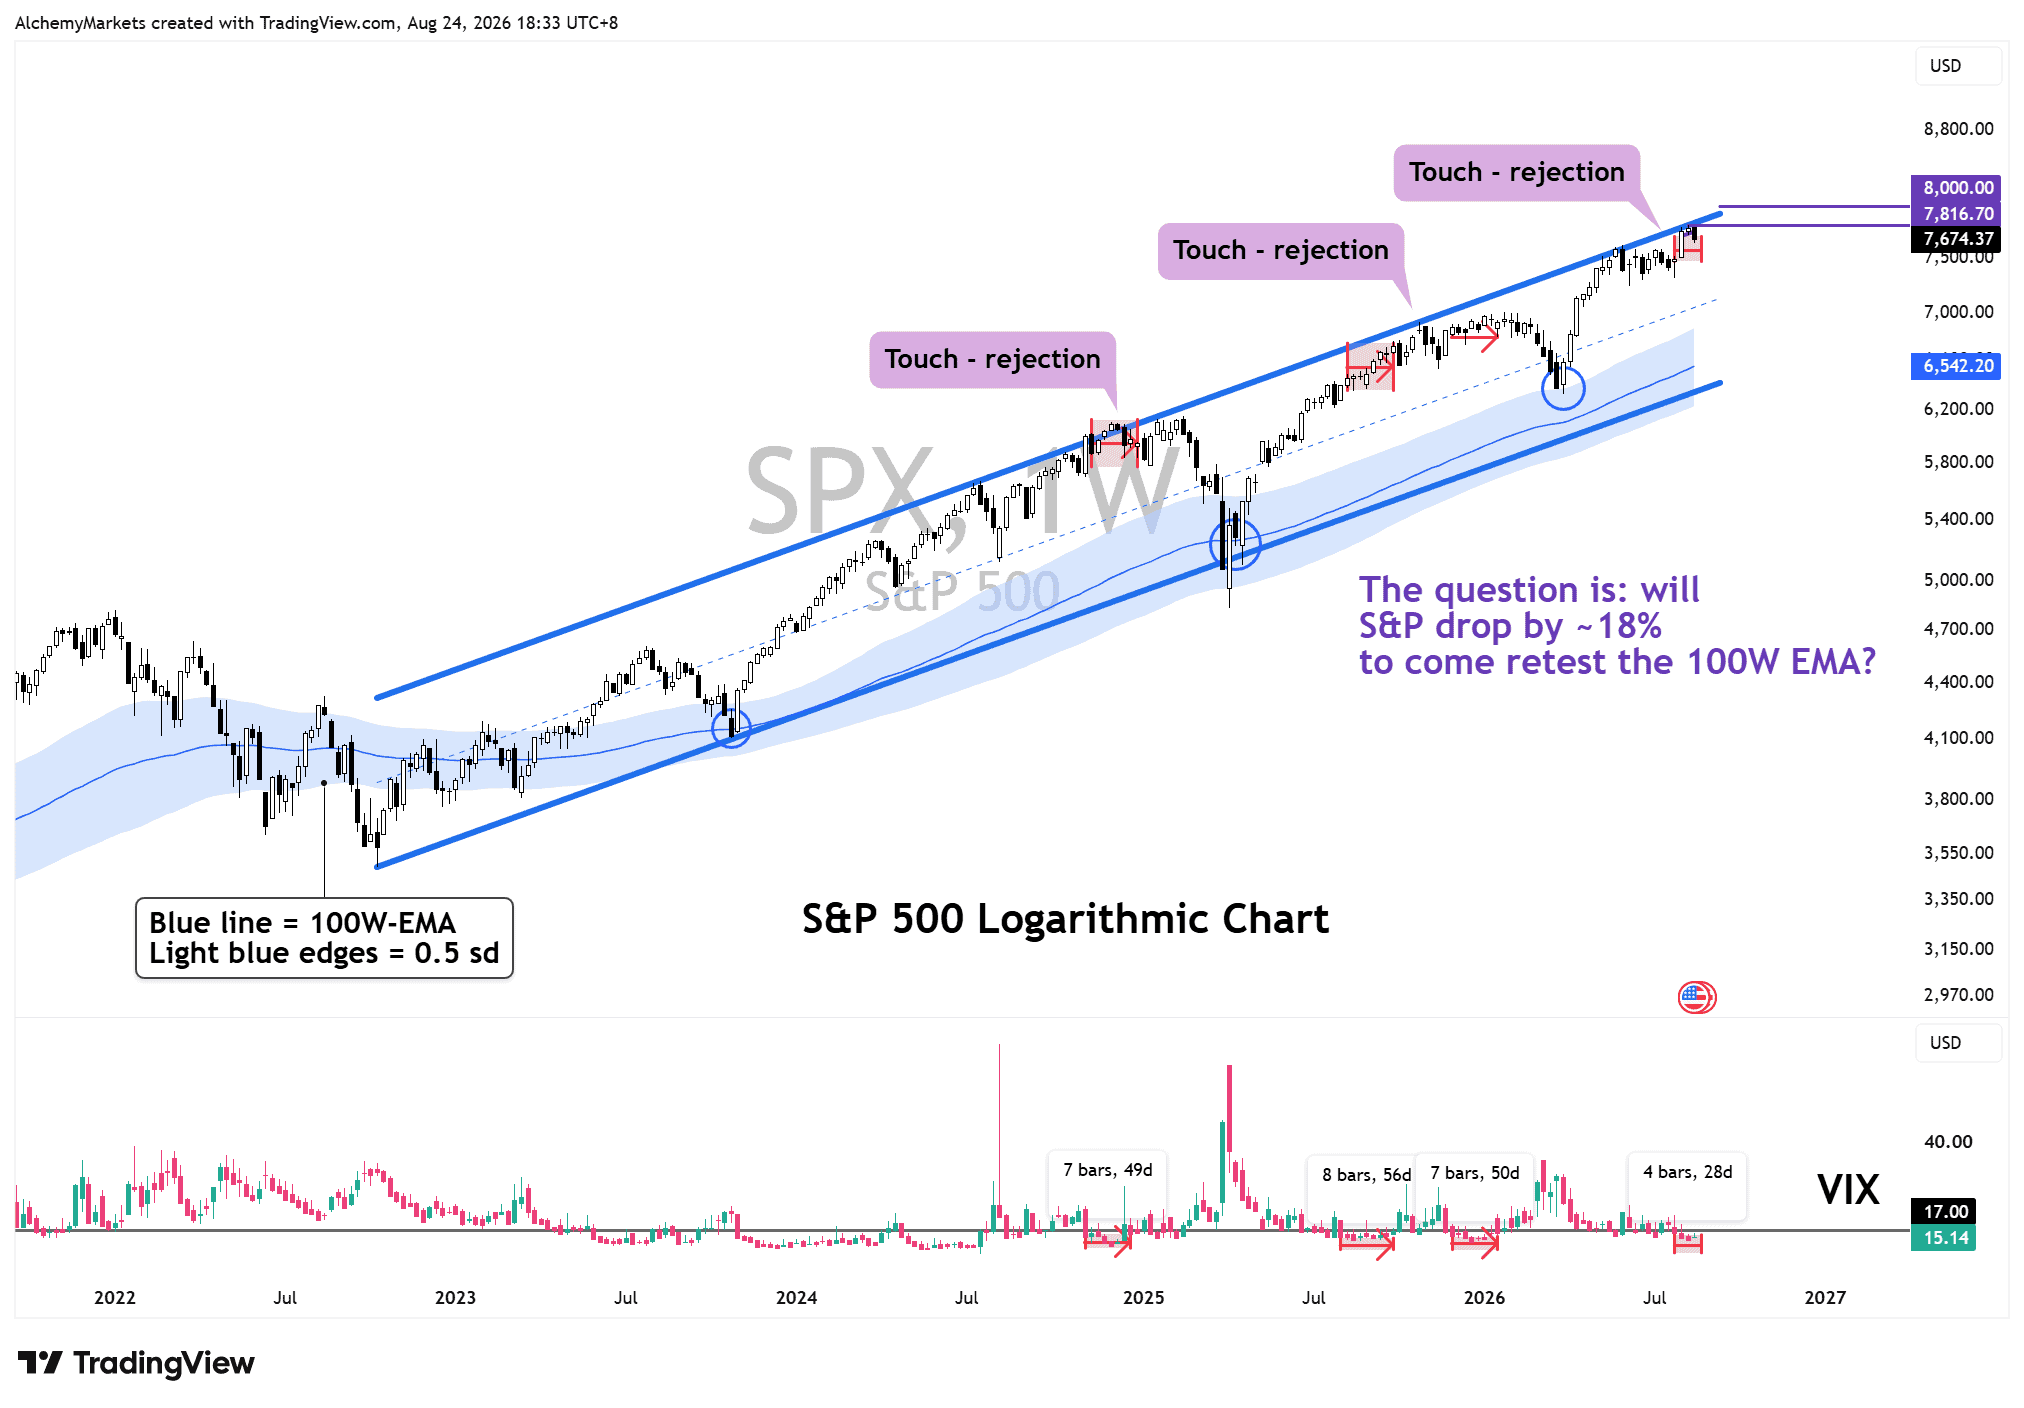
What I’m looking at is what happened during the previous three major touches; two times in 2024, once in 2025
Each time, the S&P experiences, though not always to the 100W-EMA, a fairly meaningful decline
For myself, that’s more of a reason to be cautious with overnight buy positions here.
On the weekly timeframe, the VIX has now spent around four weeks below 17.00, but historically, there is still room for that low-volatility environment to continue to 7-8 weeks.
So, what that means is that we could still see the S&P grind higher into the 7,816 to 8,000 zone before finding stronger resistance, especially with 8,000 being such an obvious psychological level.
So again, I’m not calling for an immediate reversal.
What’s next in the week?
Realistically, the next major equity test is Nvidia.
The global chip company reports earnings this Wednesday after the closing bell, and I wouldn’t be surprised if the broader market stays relatively quiet ahead of that.
So over the next few days, I’m mainly watching two things.
For oil:
- Will the 4H 50-EMA band continue to act as support for the local uptrend?
- And if it does, can WTI break through the 85.95–87.84 neckline area and trigger another technical move higher?
And for equities:
- Can the S&P continue grinding towards 7,816–8,000?
- Or do we finally start seeing volatility pick up as price sits around the top of this long-term channel?
For now, neither chart is telling me the market has to reverse immediately.
But both are sitting at areas that could make or break the other market. And I’d rather pay attention than get too comfortable.
Author

Zorrays Junaid
Alchemy Markets
Zorrays Junaid has extensive combined experience in the financial markets as a portfolio manager and trading coach. More recently, he is an Analyst with Alchemy Markets, and has contributed to DailyFX and Elliott Wave Forecast in the past.
















