Hidden Markov regimes

S2N spotlight
My apologies I ended up going down a rabbit hole that has literally taken me about 12 hours. 10 more than I had planned on. This is a bit of a complex subject, but I am going to make it as simple as I can. My goal was to explore a concept and see if I could generate outperformance with the benefit of machine learning (AI, as people call it these days) and see how it sat with me. I am not sure I will trade something I don’t fully understand what is going on under the hood.
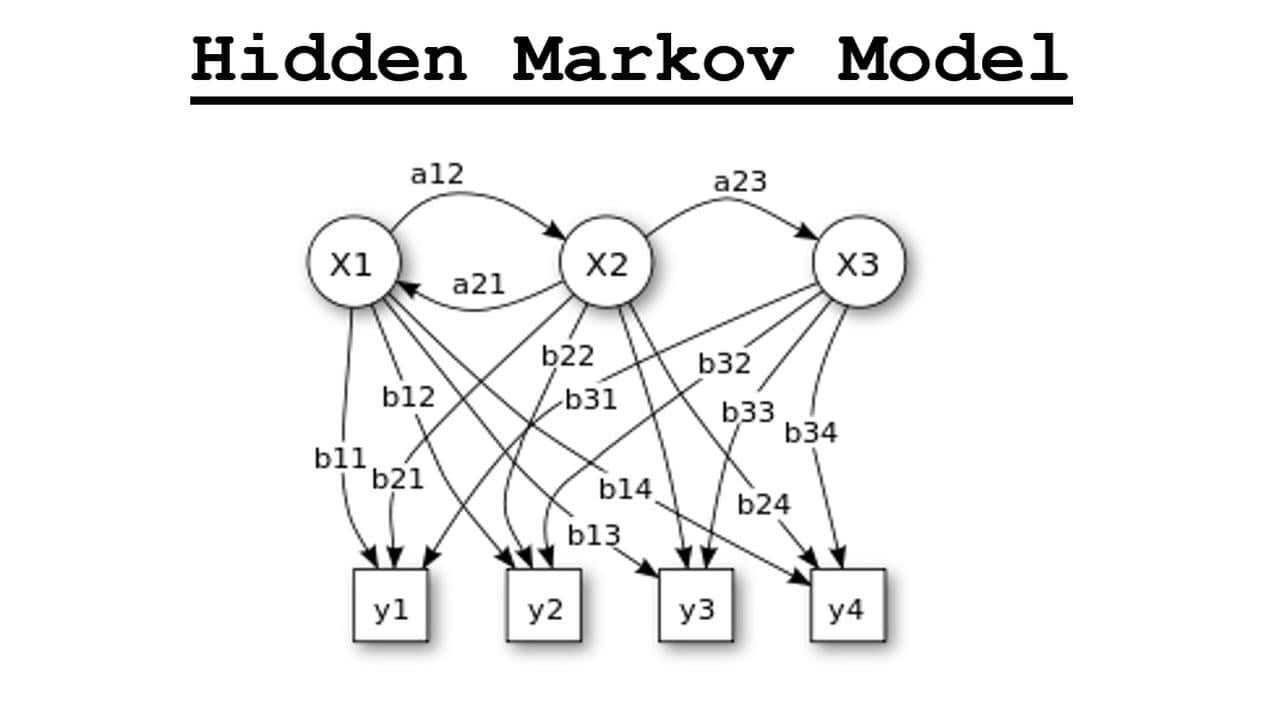
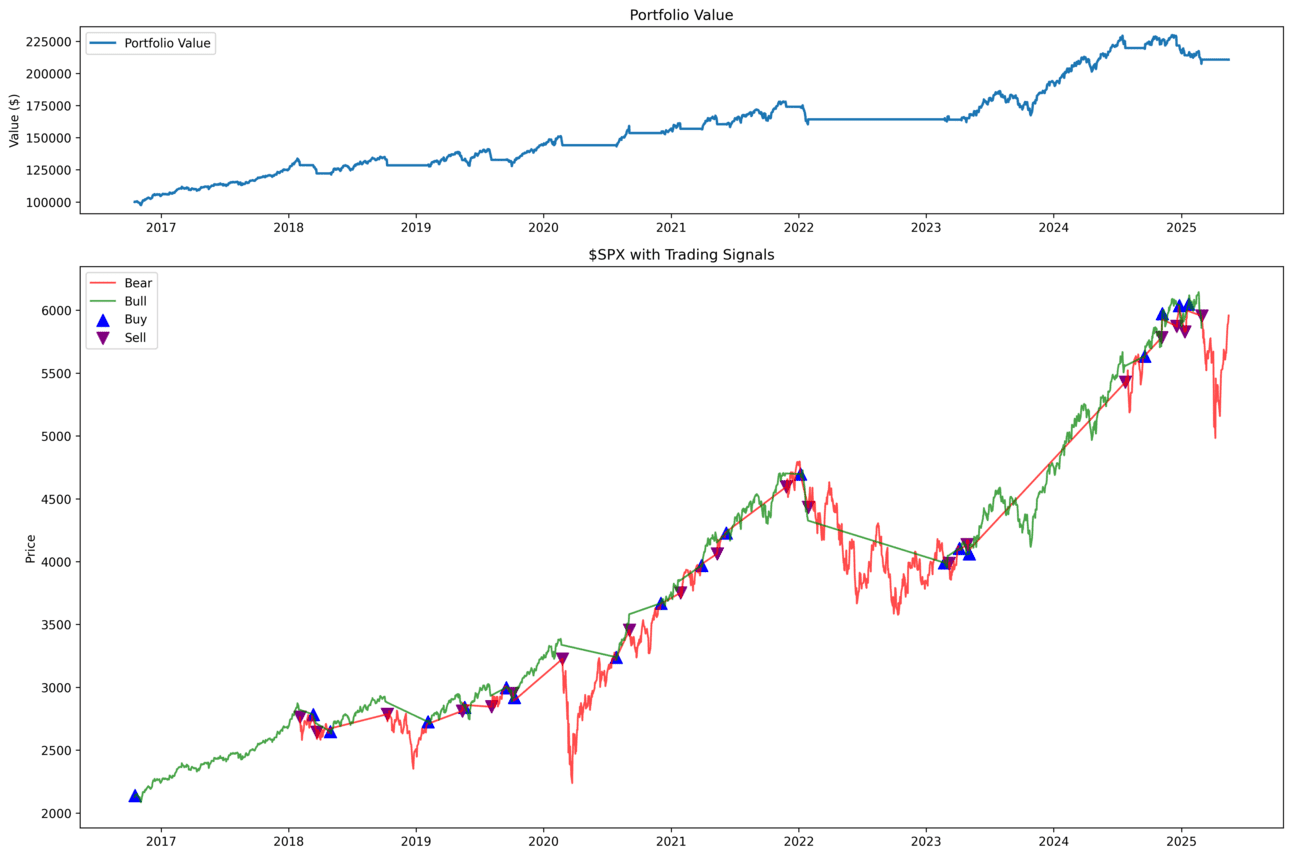
Let’s start with a pretty picture. This is for the geeks. Don’t worry about it.
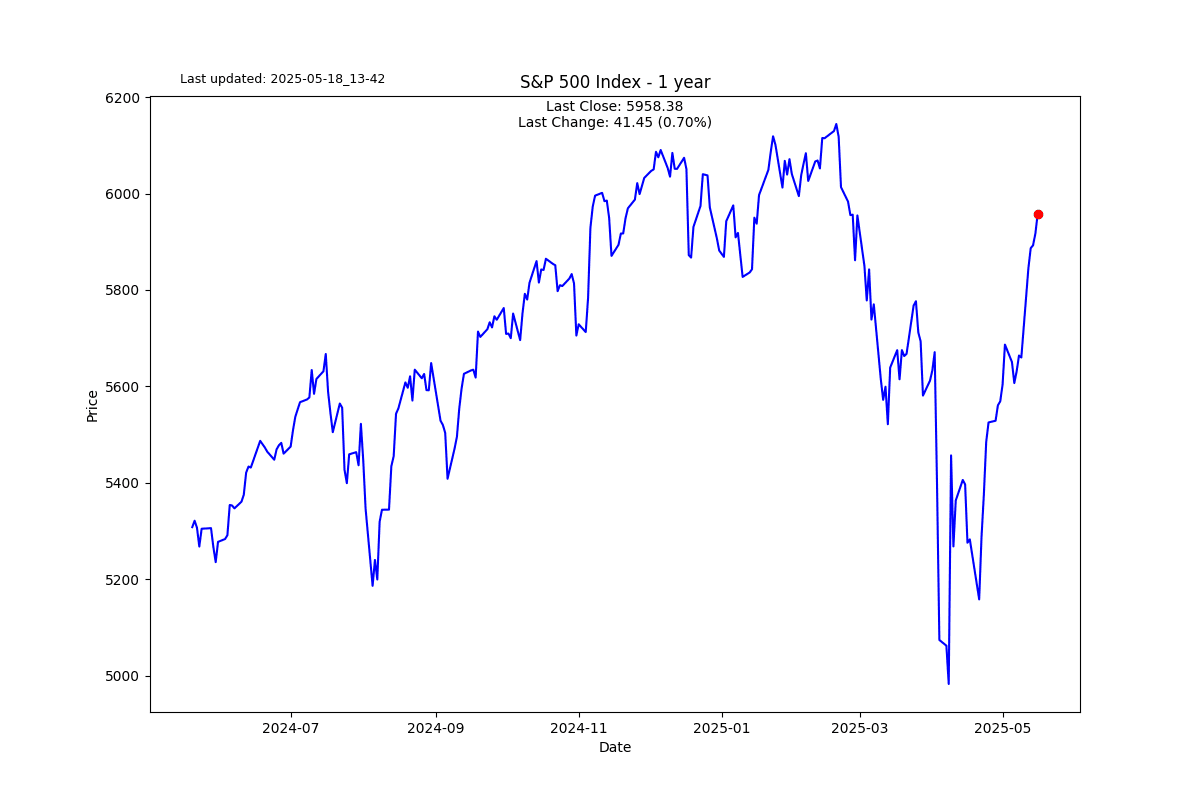
My goal this morning was to see if I could build a market timing model for the S&P 500 by detecting a bullish or bearish regime. I wanted to send it full-ball quant and not come up with my own definitions of a bullish or bearish regime and let quantitative finance have its say.
I knew from experience that the classic approach is to try and identify hidden Markov transitions. So this is what I have done. First, a definition so that we are all talking the same Russian.
Definition
A Hidden Markov Model (HMM) is a statistical model that assumes there are underlying, unobservable (hidden) states that drive observable outcomes. These states are "hidden" because we can only see the results (the observable data), not the states themselves.
When applied to something like the S&P 500 daily time series, the idea is that the market is in one of a set of hidden states (like "bull market," "bear market," or "sideways market"), but we can only observe the price movements of the S&P 500 (the observable data).
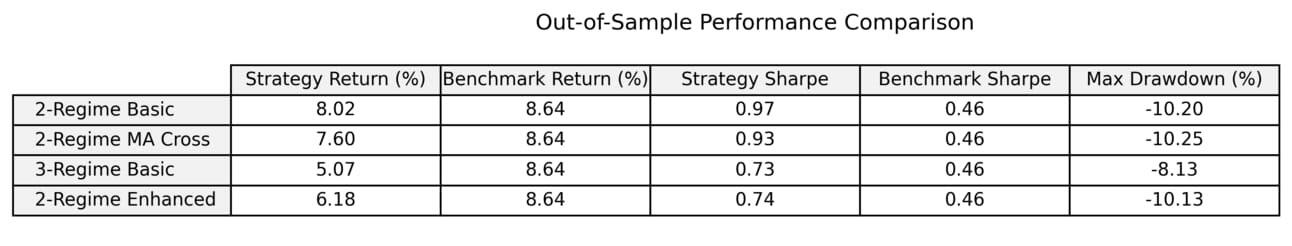
I am going to actually start with the end result I have captured in a table with the 4 different models I came up with. I trained the model with daily data from 1950 to 2015-12-31 and then ran the model out of sample from 2016-01-01 until today. I am sharing where I am up to, as the time is late. There is every possibility my models have errors, so take this with a pinch of salt, but I am excited to have a baseline.
What you see below is that none of the 4 models beat the annual return of the benchmark S&P 500. However, from a Sharpe Ratio and Max Drawdown, the 4 strategies outperform. What is interesting is that the simplest model, a basic 2-regime (bull/bear), outperforms the other models, which is exactly how I like it.
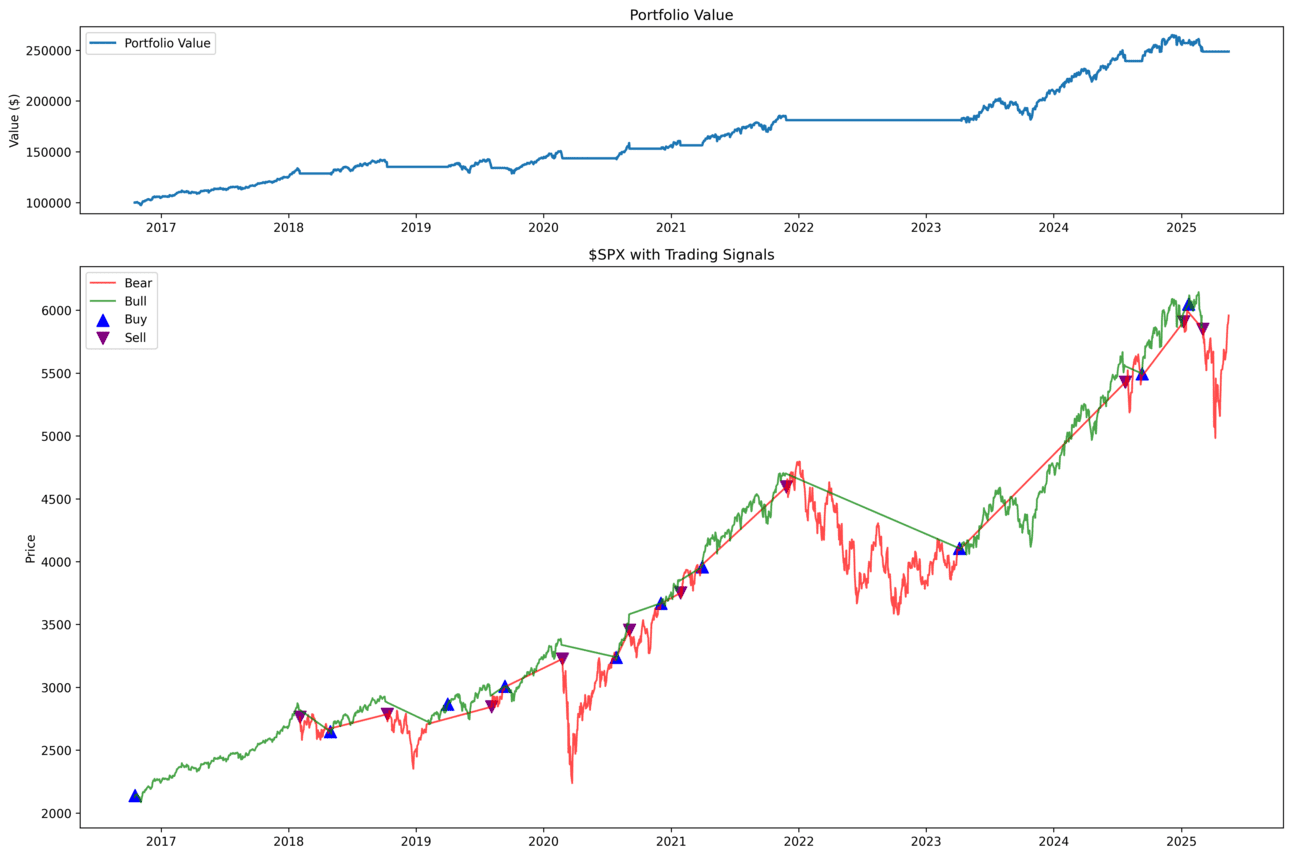
Let me share how the models time the market.

Simple 2 Regime Model-Out of Sample.
MA + 2 Regime Model-Out of Sample.
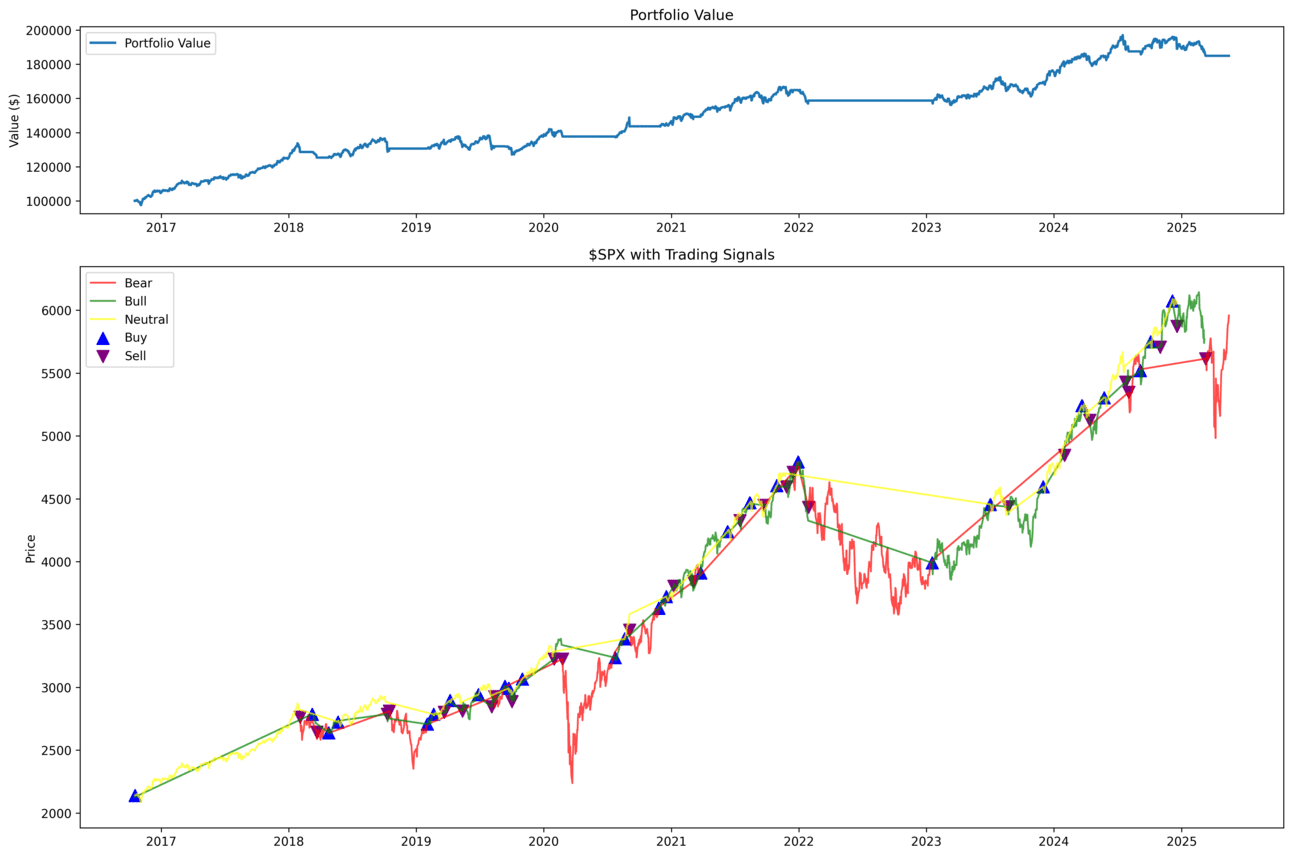
3 Regime Model-Out of Sample.
2 Regime Enhanced Model-Out of Sample.
In summary, I need to double-check everything, but building a timing component into a portfolio such as an equity/bond portfolio or any other allocation model is potentially very powerful. It turns out I understood more of what drove the model than I expected. But 12 hours is not enough. I need to spend a lot more time exploring.
S2N observations
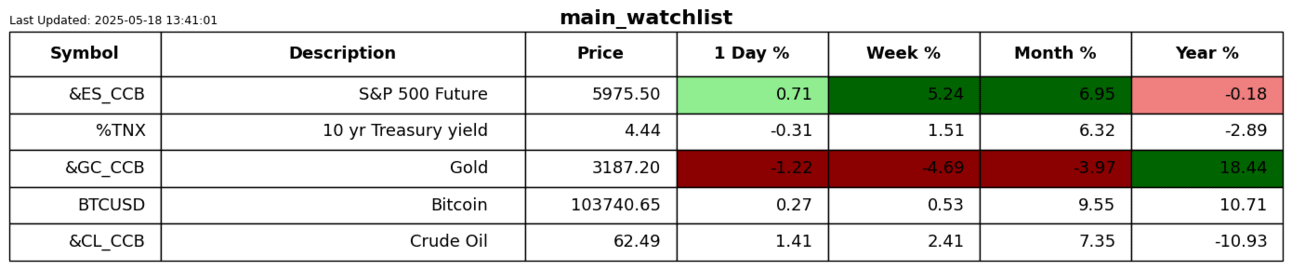
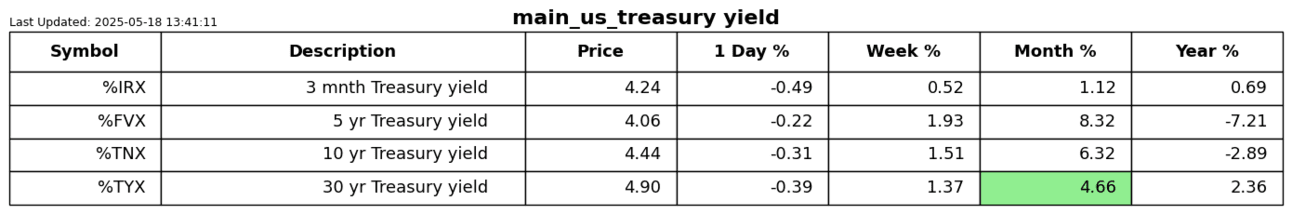
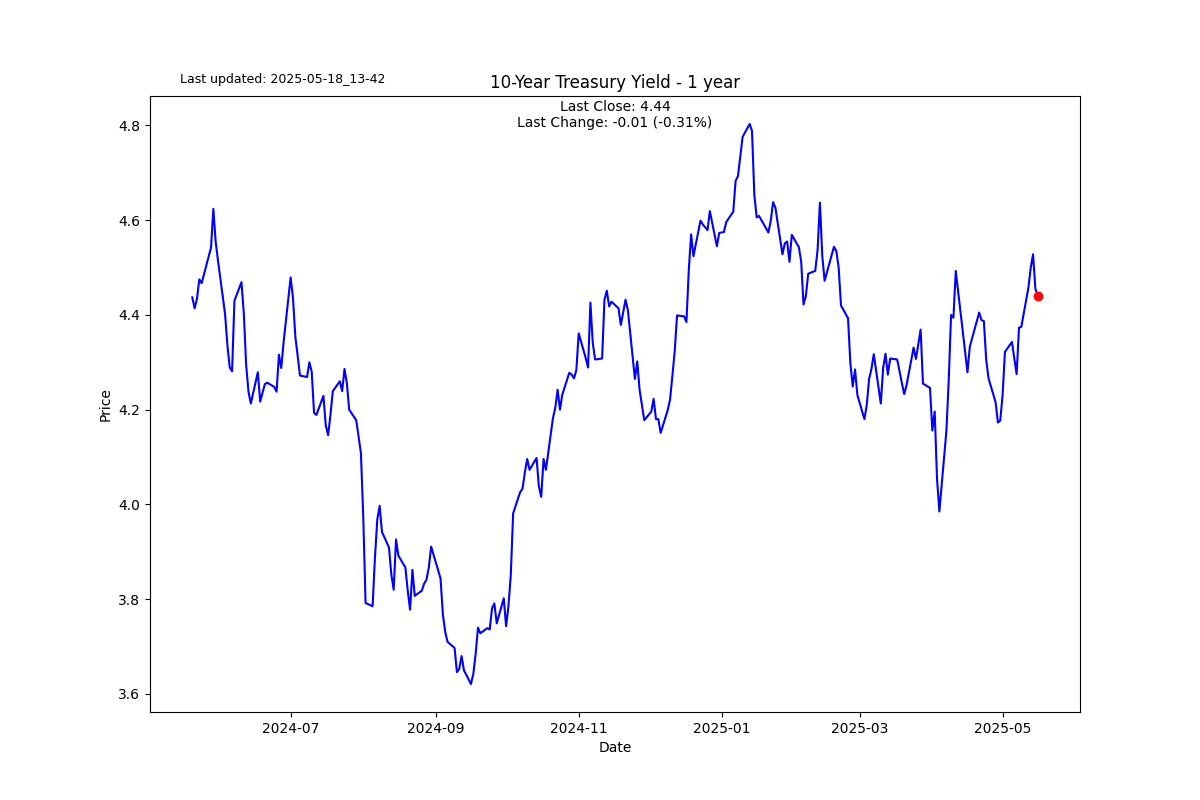
There is a lot going on at the moment; the big news right now is the 20-year and 30-year US bonds trading above 5%, on the back of a Moody’s downgrade.
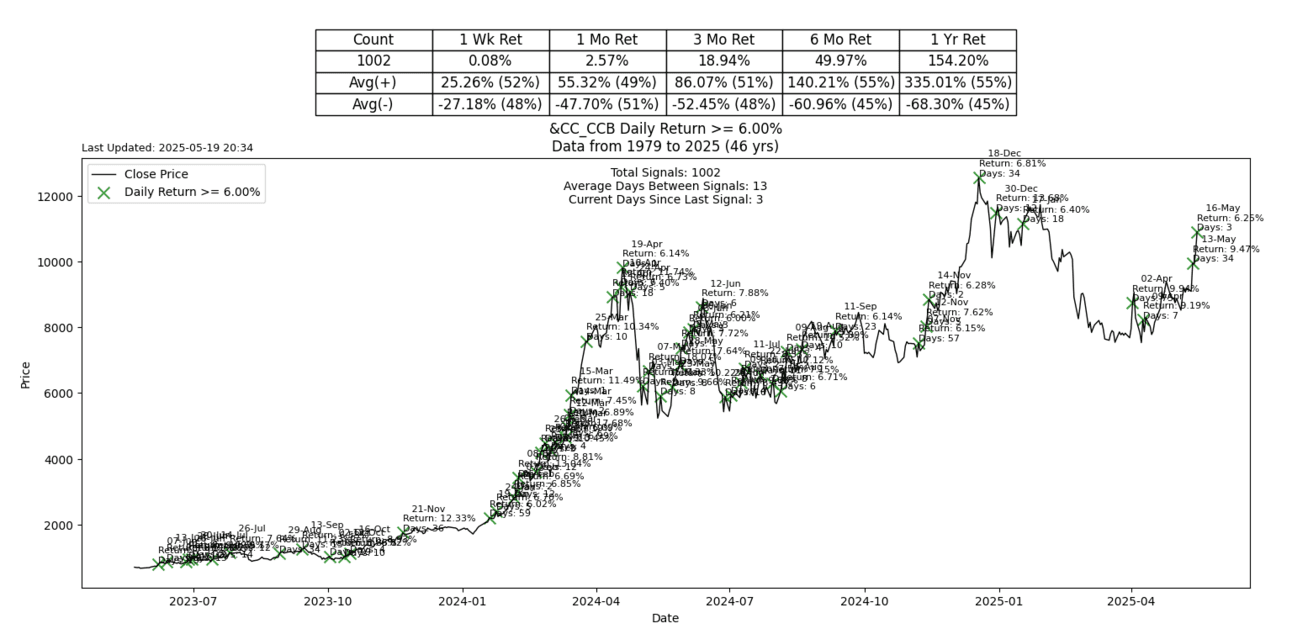
S2N screener alert
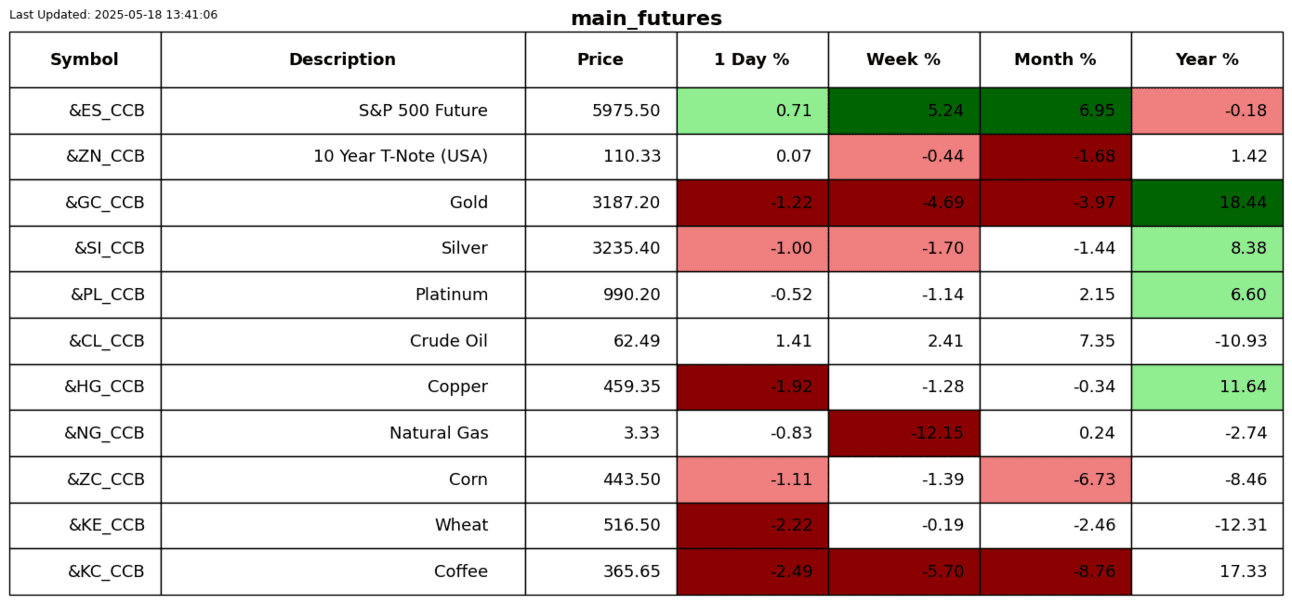
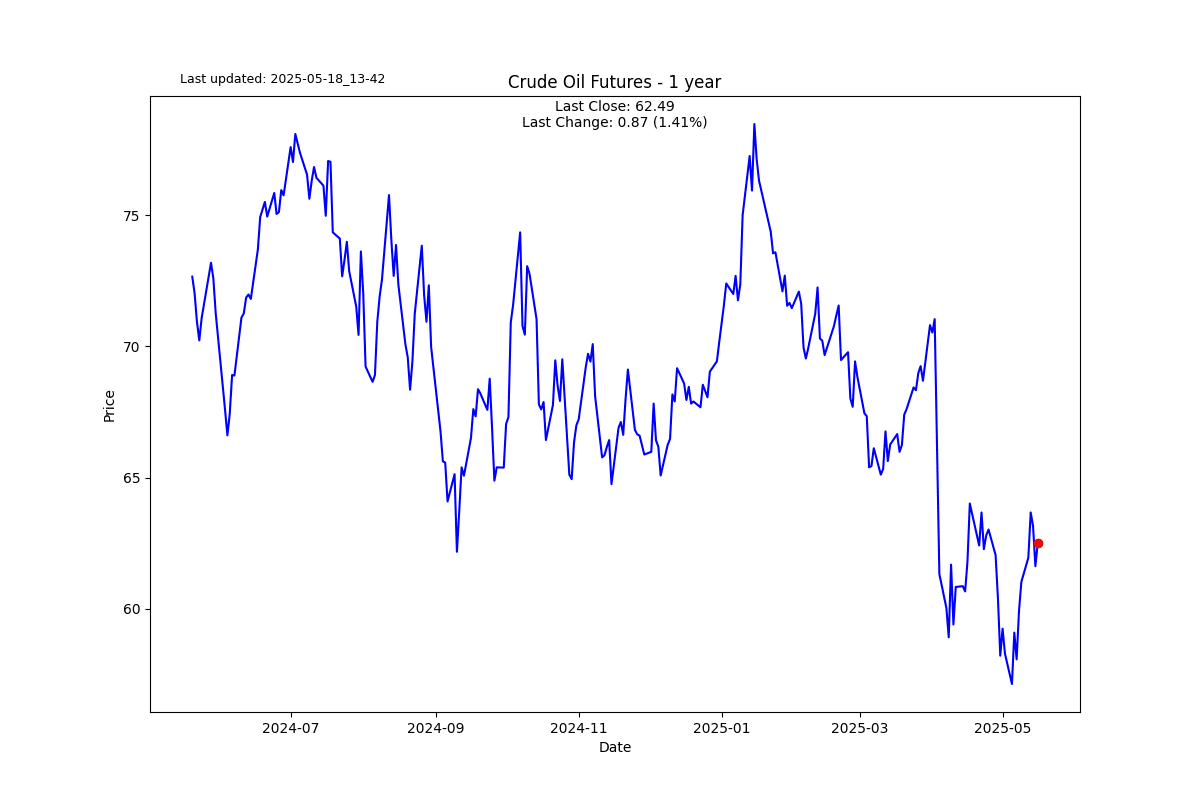
Cocoa futures were up 6% on Friday, not such an unusual move. It has done it 1002 times in 46 years. But I am alerting you to the fact that a new high is on the cards, which is inflationary and tragic for our household.
S2N performance review

S2N chart gallery
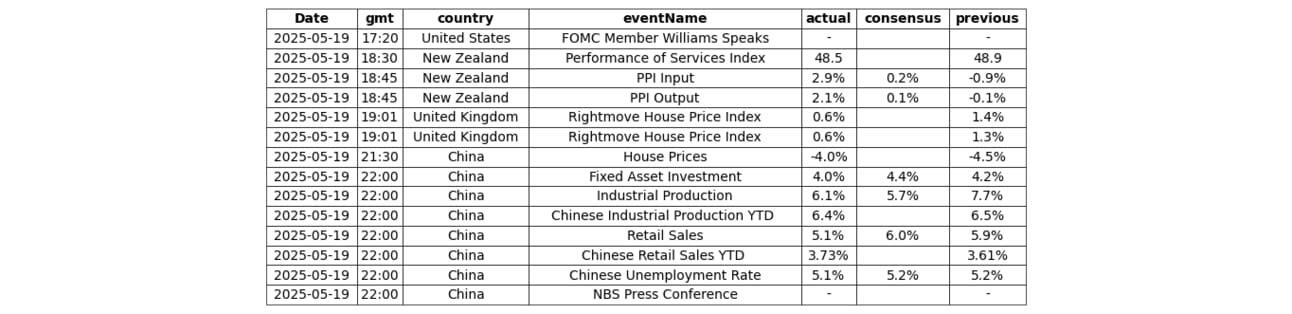
S2N news today
Author

Michael Berman, PhD
Signal2Noise (S2N) News
Michael has decades of experience as a professional trader, hedge fund manager and incubator of emerging traders.


