Hidden curves
S2N spotlight
Today’s letter is a bit technical, but I believe it’s worth the effort.
I was sitting in my office staring at a blank letter template when my son, who lives in Israel, walked in and said, “Let me check your setup.” I walked him through my process and said, for the first time in 275 letters, I don’t know what to write about.
After he went to fire up the BBQ, something popped into my head, so here goes. By the way, the smell of boerewors is fighting for my attention.
Bill Clinton is quoted in Bob Woodward’s book The Agenda (1994) with this classic:
"You mean to tell me that the success of the program and my re-election hinges on the Federal Reserve and a bunch of #ucking bond traders?"
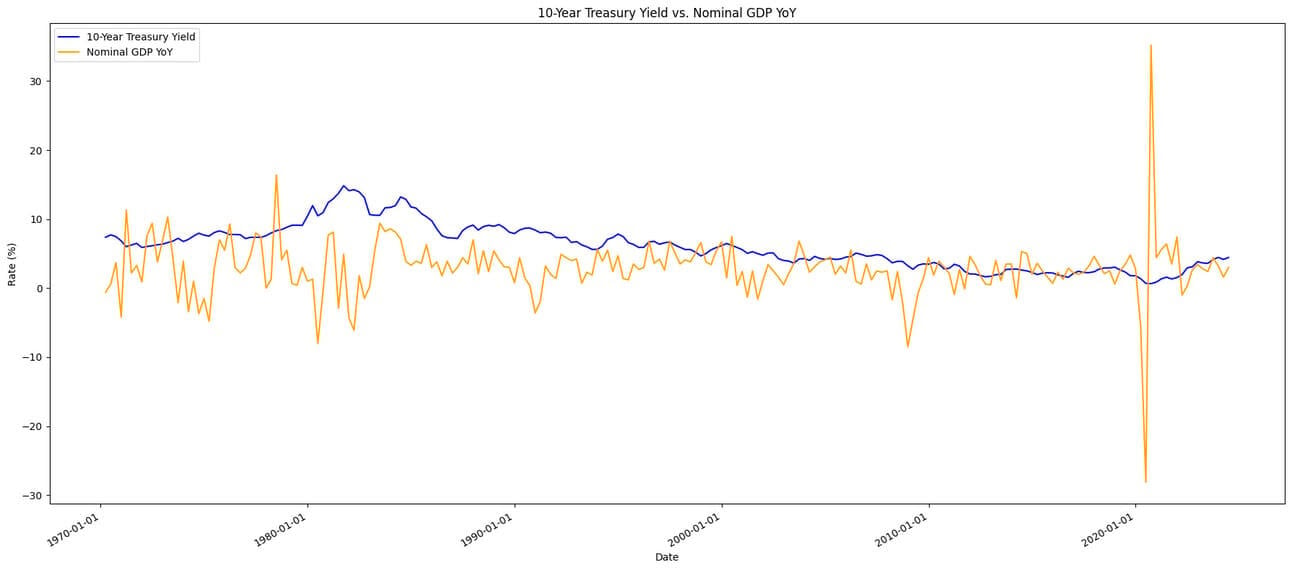
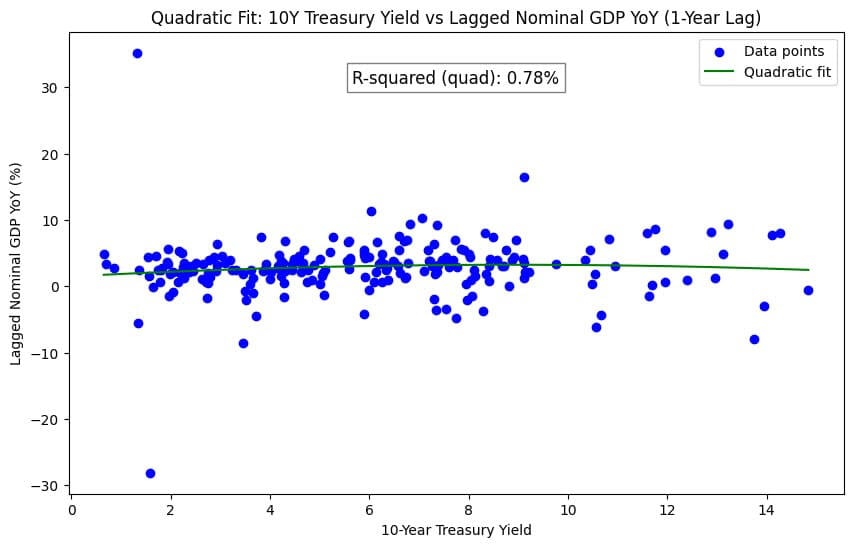
There you have it, folks, a priceless insight. Here is my insight. I had this chart filed in my random charts directory. It is the 10-year treasury yield and the nominal GDP year-on-year growth rate. You can see with the naked eye there is clearly a relationship between these 2 time series.
My journey towards greater insight comes in 3 stages.
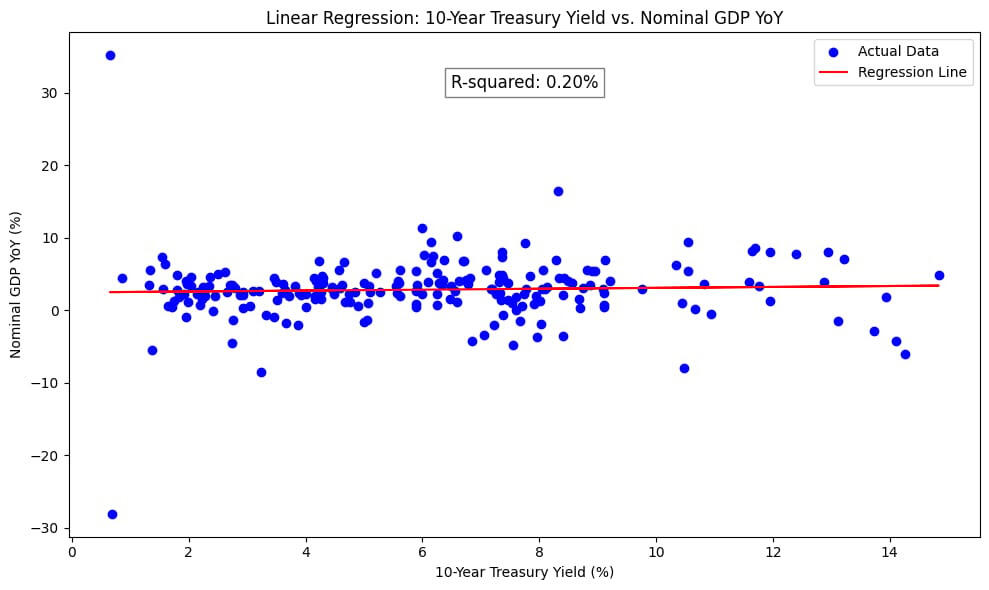
First, I create a linear regression and come up with an R² of 0.2, which means that 20% of the GDP can be explained by the yield of the 10-year. It might seem low, but in finance/economics the data is notoriously noisy, so 20% is not necessarily bad.
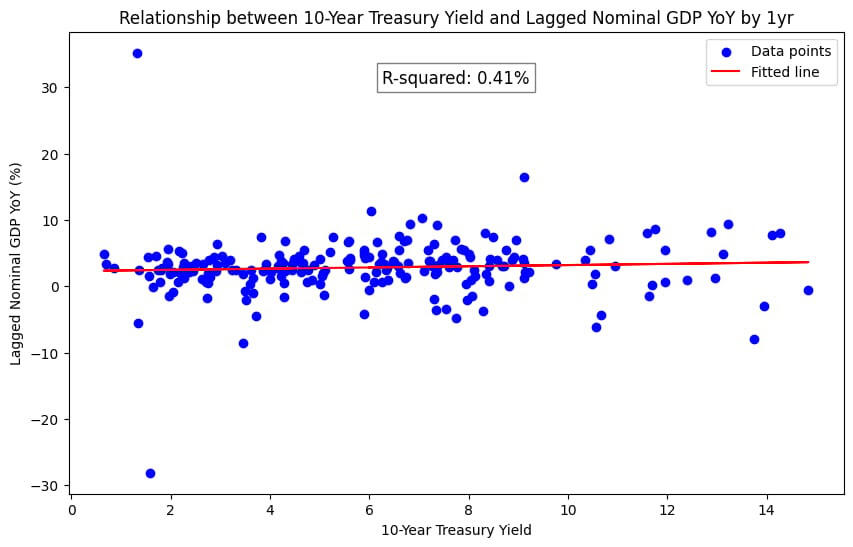
Second we all know that the economy lags interest rates, so it would make sense to lag the GDP for, say, 1 year to see if it helps explain things better. Bingo - it takes the R² to 41%. Now we're talking. 41% ability to explain the dependent variable is nice.
Third, nice guys often come last. What can we do to improve our odds? Let me share my thought process. I don’t think a simple linear up-sloping line explains the relationship. I think the higher yields go, the worse an economy should perform. Also, it seems logical to me that if interest rates drop very low, economic performance might suffer. Let us welcome the quadratic non-linear regression. The hidden curve is visible in the green line below. Importantly, we get an R² equal to 78%.
The boerewors was delicious.
S2N observations
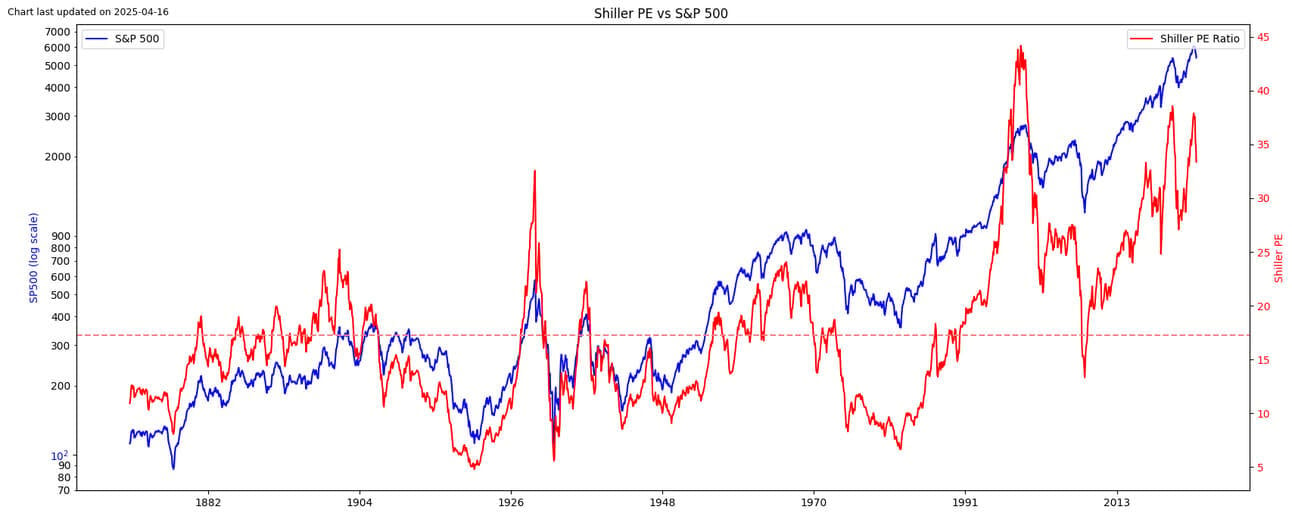
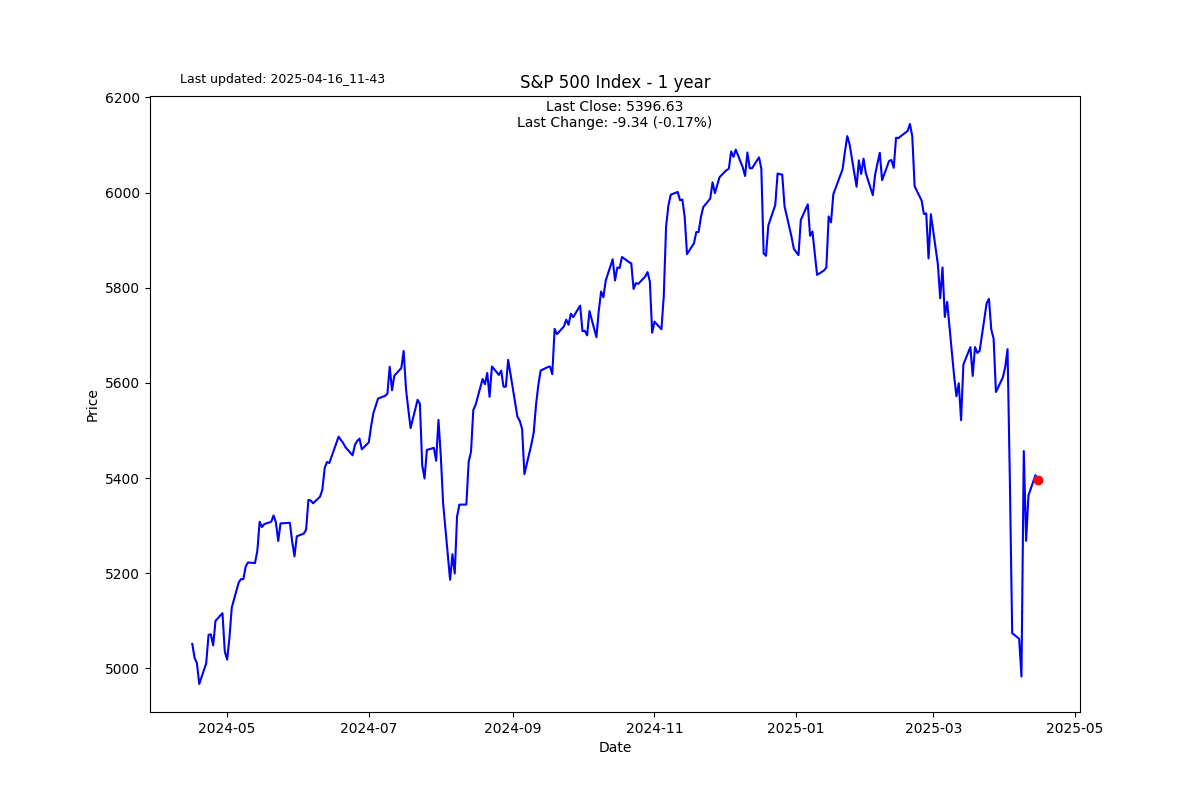
The S&P 500 valuations are still too elevated for my liking, using my preferred Shiller PE ratio.
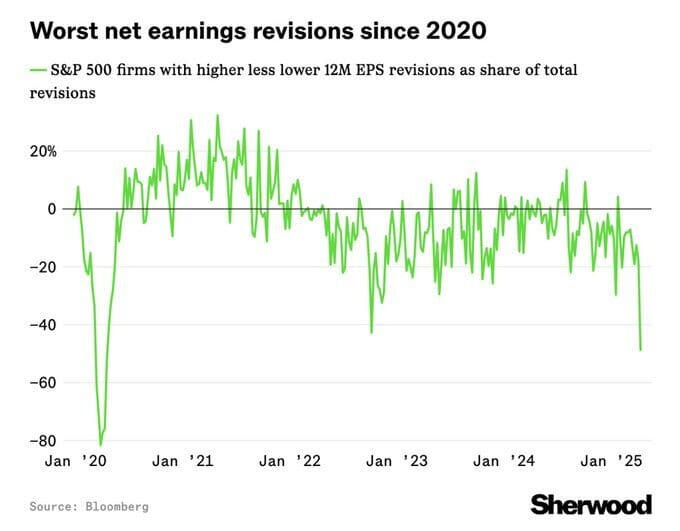
I think earnings revisions are about to make valuations even more expensive.
S2N screener alert
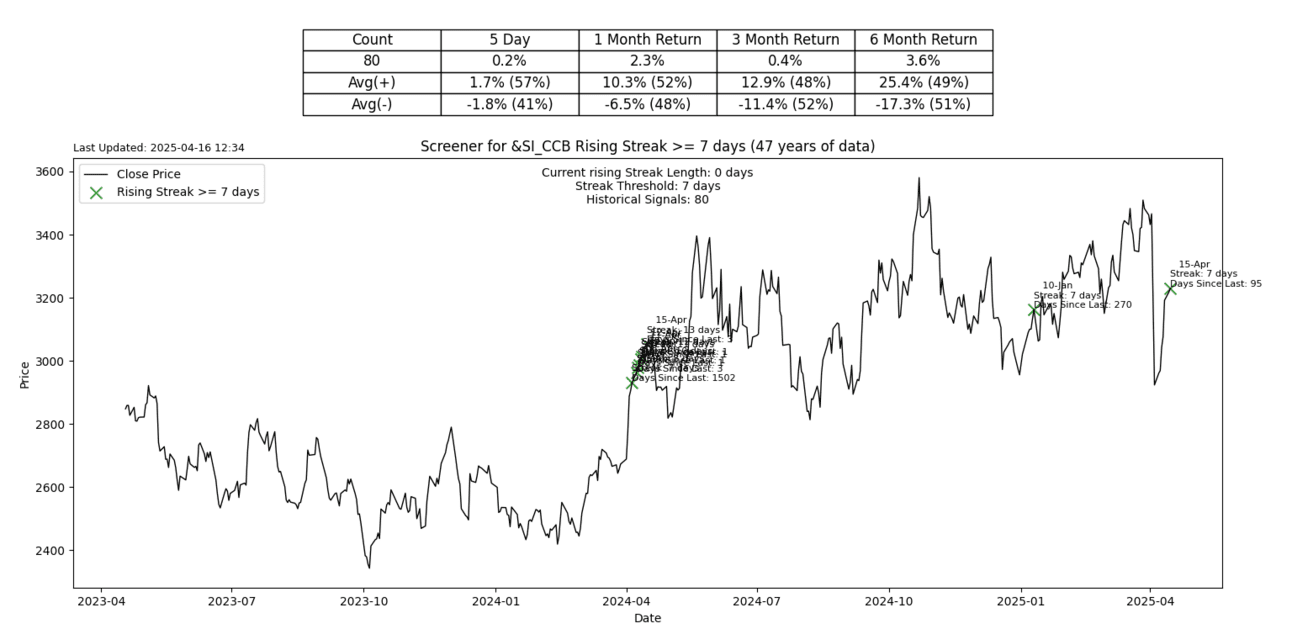
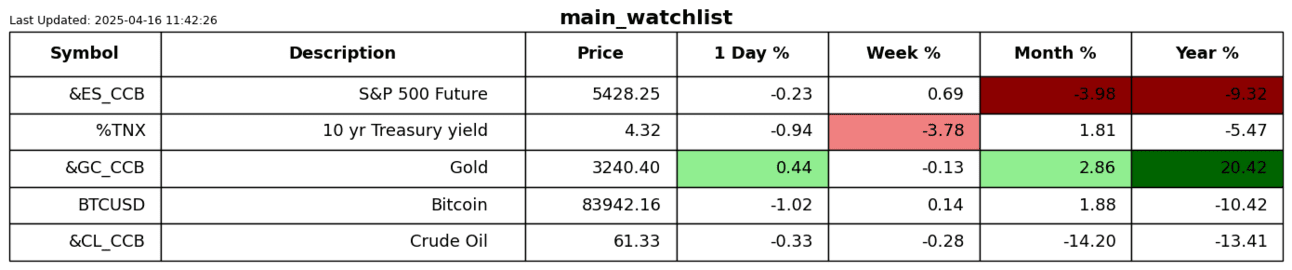
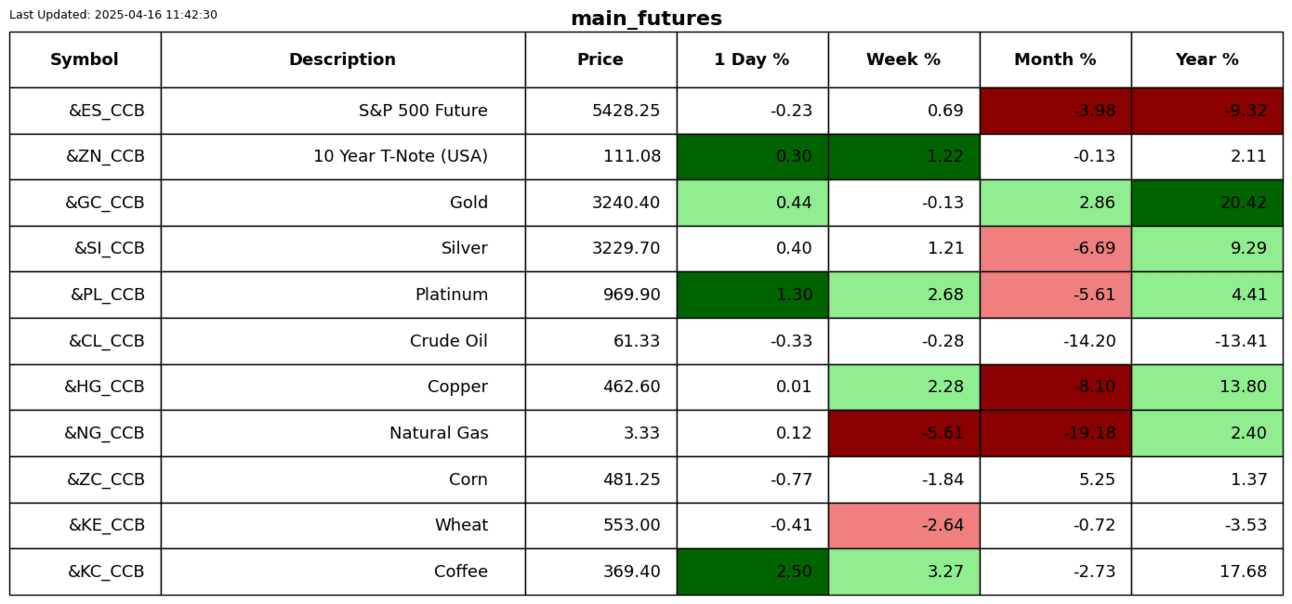
Silver rallied for its 7th day in a row.
S2N performance review
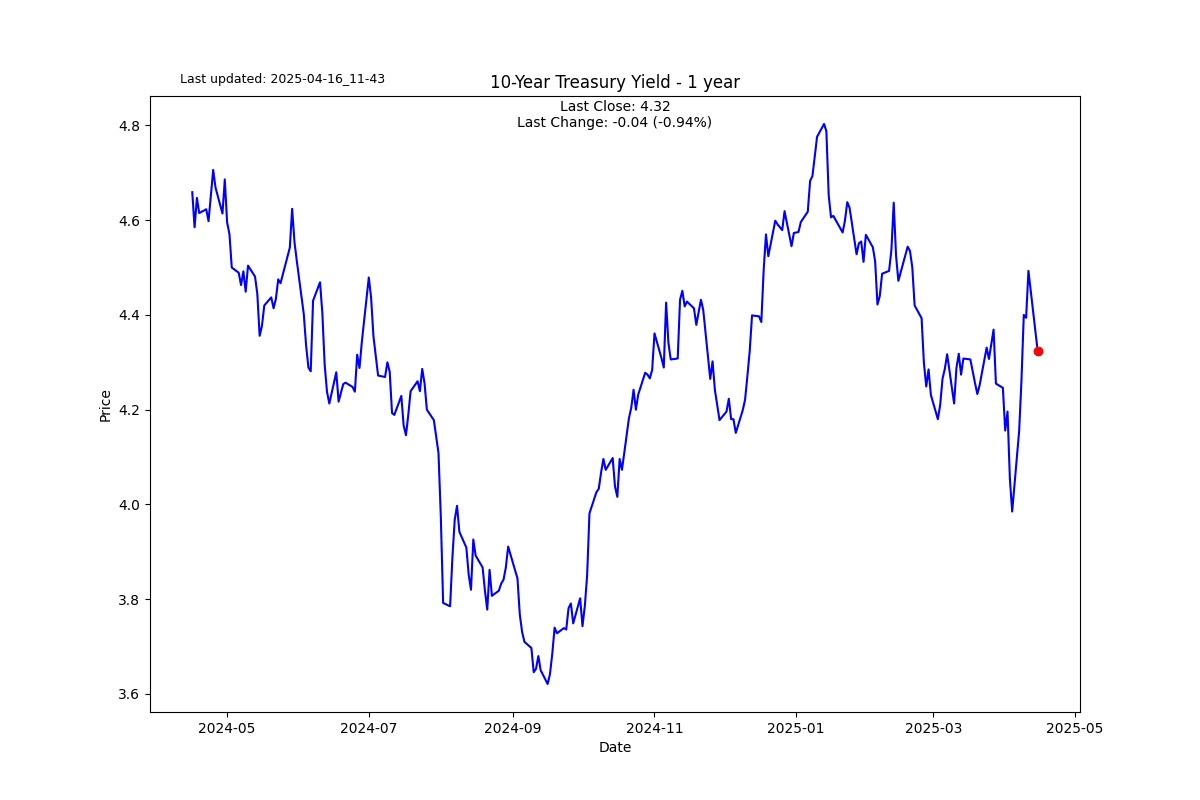
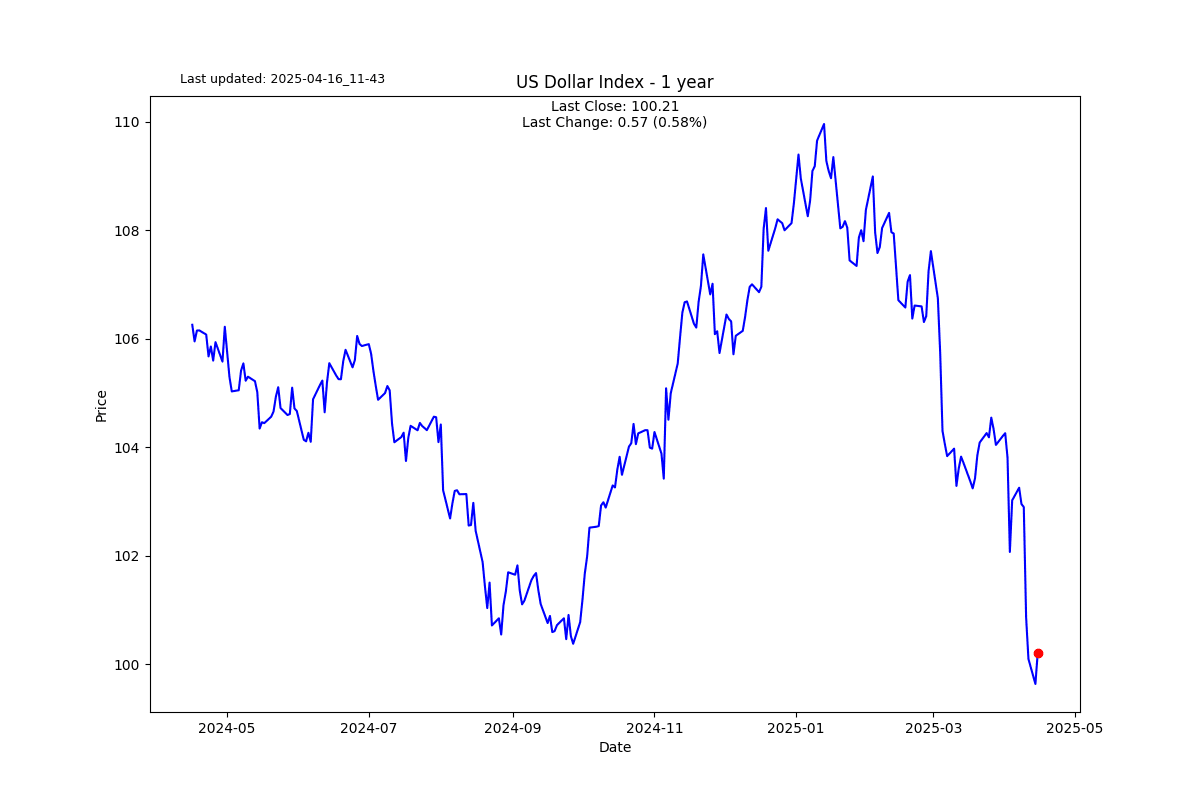
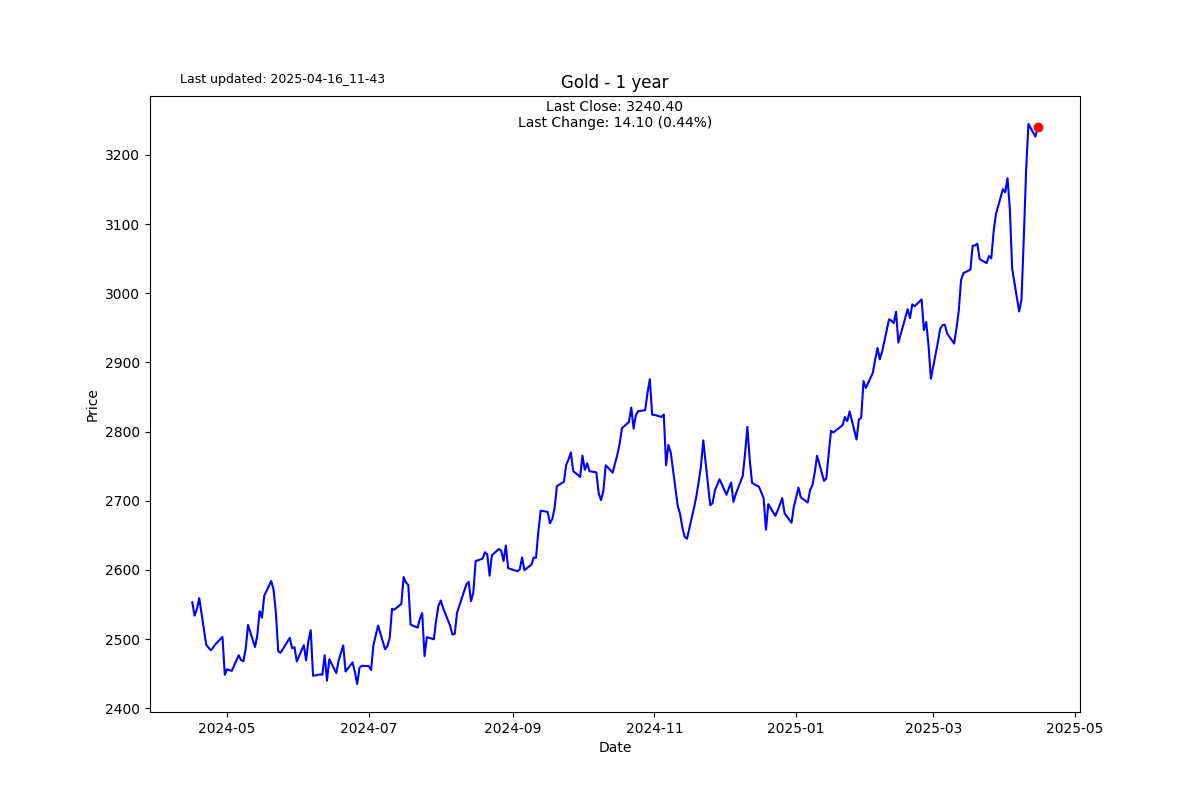
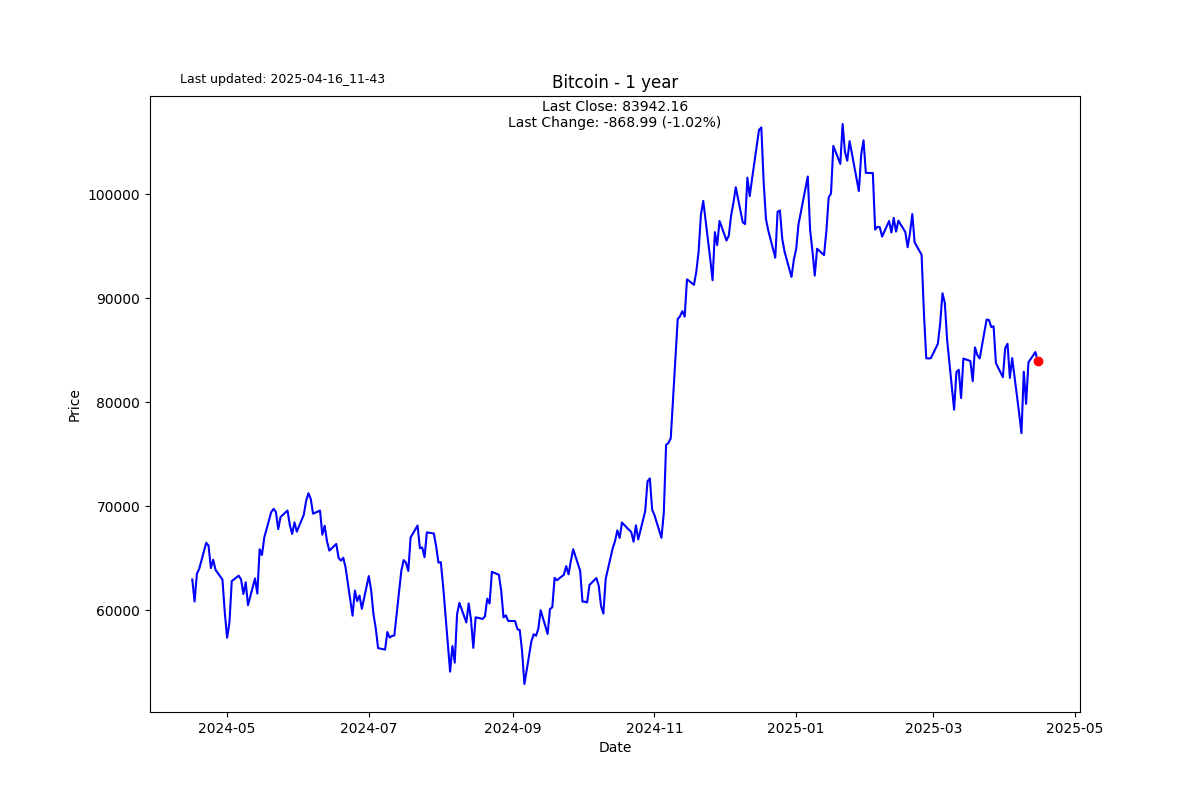
S2N chart gallery
S2N news today
Author

Michael Berman, PhD
Signal2Noise (S2N) News
Michael has decades of experience as a professional trader, hedge fund manager and incubator of emerging traders.


