He’s Back, again

Good Morning Traders,
As of this writing 4 AM EST, here's what we see:
US Dollar: Dec. USD is Up at 92.200.
Energies: Nov Crude is Down at 50.43.
Financials: The Dec 30 year bond is Up 5 ticks and trading at 154.08.
Indices: The Dec S&P 500 emini ES contract is 11 ticks Lower and trading at 2496.75.
Gold: The Dec gold contract is trading Down at 1294.80. Gold is 27 ticks Lower than its close.
Initial Conclusion
This is not a correlated market. The dollar is Up+ and Crude is Down- which is normal and the 30 year Bond is trading Higher. The Financials should always correlate with the US dollar such that if the dollar is lower then bonds should follow and vice-versa. The indices are Lower and Crude is trading Down- which is not correlated. Gold is trading Down- which is correlated with the US dollar trading Up+. I tend to believe that Gold has an inverse relationship with the US Dollar as when the US Dollar is down, Gold tends to rise in value and vice-versa. Think of it as a seesaw, when one is up the other should be down. I point this out to you to make you aware that when we don't have a correlated market, it means something is wrong. As traders you need to be aware of this and proceed with your eyes wide open.
At this hour all of Asia is trading Lower with the exception of the Nikkei exchange which is higher at this hour. As of this writing Europe is trading Mixed with half the exchanges higher and the other half lower.
Possible Challenges To Traders Today
-
FOMC Member Dudley Speaks at 8:30 AM. This is major.
-
FOMC Member Evans Speaks at 12:40 PM. This is major.
Treasuries
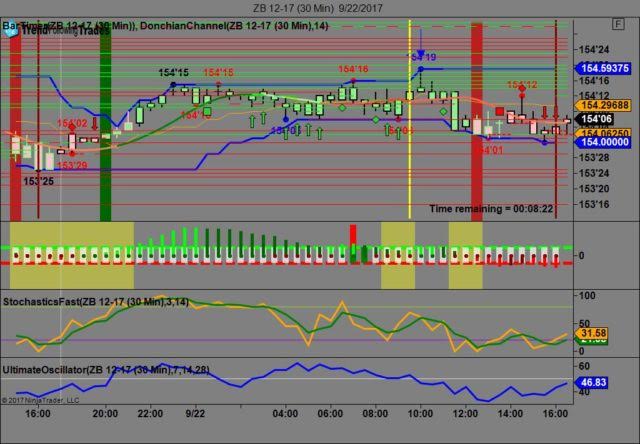
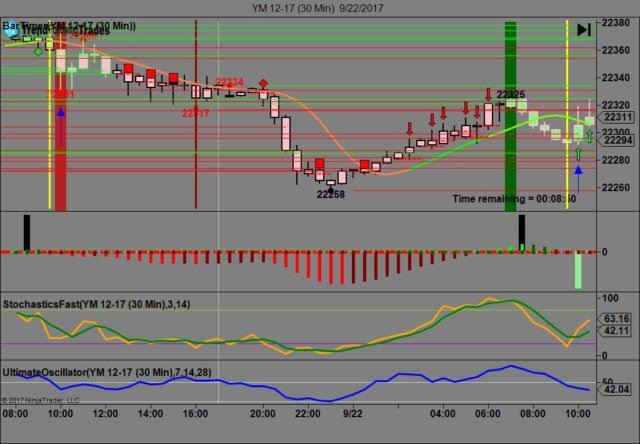
We've elected to switch gears a bit and show correlation between the 30 year bond (ZB) and The YM futures contract. The YM contract is the DJIA and the purpose is to show reverse correlation between the two instruments. Remember it's liken to a seesaw, when up goes up the other should go down and vice versa.
On Friday the ZB made it's move at around 10 AM EST after the economic news was reported. The ZB hit a High at around that time and the YM hit a Low. If you look at the charts below ZB gave a signal at around 10 AM EST and the YM was moving Higher at the same time. Look at the charts below and you'll see a pattern for both assets. ZB hit a High at around 10 AM and the YM hit a Low. These charts represent the newest version of Trend Following Trades and I've changed the timeframe to a 30 minute chart to display better. This represented a shorting opportunity on the 30 year bond, as a trader you could have netted about 20 ticks per contract on this trade. Each tick is worth $31.25. We added a Donchian Channel to the charts to show the signals more clearly. Please note that the front month for the ZB and the YM contract is now December, 2017.
Charts Courtesy of Trend Following Trades built on a NinjaTrader platform
Bias
On Friday we called for a downside bias as both the Bonds and Gold were both trading higher and ordinarily this bodes well for a downside day. The Dow dropped 10 points and the other indices gained slightly. Today we aren't dealing with a correlated market and our bias is to the Downside.
Could this change? Of Course. Remember anything can happen in a volatile market.
Commentary
Just when we think the North Korean guy is out of the water and should be ignored; he isn't. This started last week when Trump publicly stated that North Korea may have to be destroyed and this prompted Kim Jong Un to retaliate. Kim is now stating that he'll fire an above ground hydrogen weapon over the Pacific which environmentally wouldn't be sound.
Author

Nick Mastrandrea
Market Tea Leaves


