Here is how to identify the market bottom with this breadth thrust indicator [Video]
![Here is how to identify the market bottom with this breadth thrust indicator [Video]](https://editorial.fxstreet.com/images/Markets/Equities/SP500/wall-street-sign-637299022550250958_XtraLarge.jpg)
Original content: Here is how to identify the market bottom with this breadth thrust indicator [Video]
Here is how to use the breadth thrust indicator as a momentum starter to determine the stock market bottom based on the past 6 events in 2009, 2010, 2011, 2016, 2018 and 2020.
Watch the video below and pay attention to establishing the context between the market breadth and the S&P 500 from the momentum aspect.
The bullish setup vs. the bearish setup is 434 to 66 from the screenshot of my stock screener below.
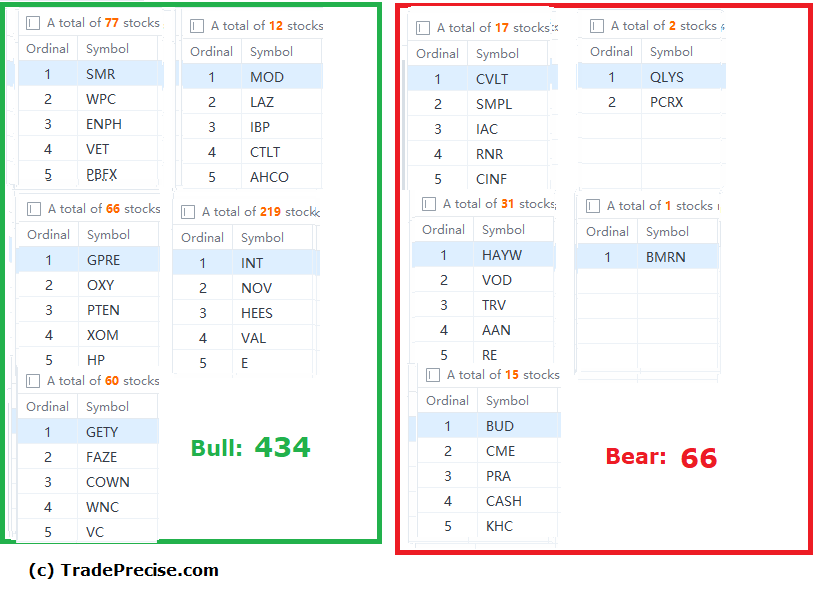
Although the bullish setups are gaining momentum, the market is short term overbought and testing the resistance zone. It is prudent to pick the best quality setup with decent reward to risk among the outperforming stocks.
Author

Ming Jong Tey
Independent Analyst
Ming Jong Tey has been trading since 2008. He started his learning journey from technical analysis (indicators, Fibonacci, etc...) to value investing. Throughout his journey, he develops an interest in price action with chart pattern trading.


