Healthcare Bill Doesn’t Help

Good Morning Traders,
As of this writing 4 AM EST, here’s what we see:
US Dollar: Sept. USD is Down at 97.070.
Energies: Aug Crude is Up at 42.79.
Financials: The Sept 30 year bond is Down 5 ticks and trading at 156.10.
Indices: The Sept S&P 500 emini ES contract is 11 ticks Higher and trading at 2434.50.
Gold: The Aug gold contract is trading Up at 1254.70. Gold is 53 ticks Higher than its close.
Initial Conclusion
This is not a correlated market. The dollar is Down- and Crude is Up+ which is normal and the 30 year Bond is trading Lower. The Financials should always correlate with the US dollar such that if the dollar is lower then bonds should follow and vice-versa. The indices are Up and Crude is trading Up+ which is not correlated. Gold is trading Up+ which is correlated with the US dollar trading Down-. I tend to believe that Gold has an inverse relationship with the US Dollar as when the US Dollar is down, Gold tends to rise in value and vice-versa. Think of it as a seesaw, when one is up the other should be down. I point this out to you to make you aware that when we don’t have a correlated market, it means something is wrong. As traders you need to be aware of this and proceed with your eyes wide open.
At this hour Asia is trading mixed with half the exchanges trading Higher and the other half Lower. All of Europe is trading Lower at this hour.
Possible Challenges To Traders Today
– Flash Manufacturing PMI is out at 9:45 AM EST. This is major.
– Flash Services PMI is out at 9:45 AM EST. This is major.
– New Home Sales is out at 10 AM EST. This is major.
– FOMC Member Powell Speaks at 2:15 PM EST. This is major.
Treasuries
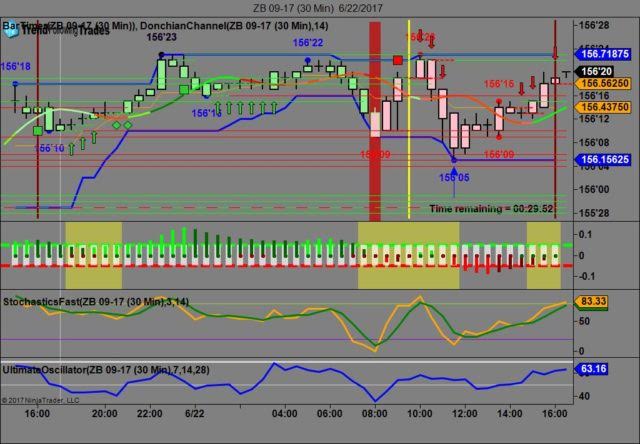
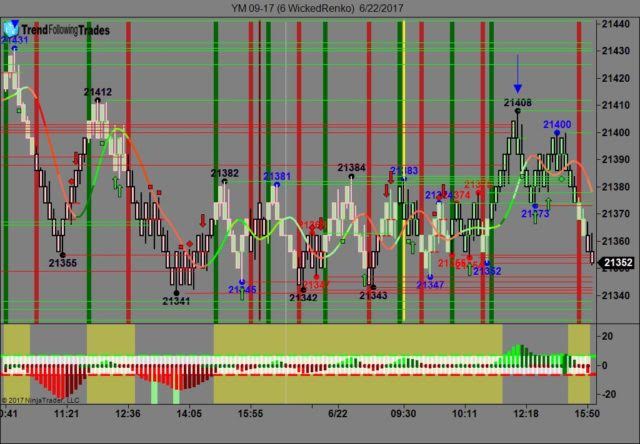
We’ve elected to switch gears a bit and show correlation between the 30 year bond (ZB) and The YM futures contract. The YM contract is the DJIA and the purpose is to show reverse correlation between the two instruments. Remember it’s liken to a seesaw, when up goes up the other should go down and vice versa.
Yesterday the ZB made it’s move at around 11:30 AM EST with no real economic news in sight. The ZB hit a low at around that time and the YM hit a high. If you look at the charts below ZB gave a signal at around 11:30 AM and the YM was moving lower at the same time. Look at the charts below and you’ll see a pattern for both assets. ZB hit a low at around 11:30 AM and the YM hit a high. These charts represent the newest version of Trend Following Trades and I’ve changed the timeframe to a 30 minute chart to display better. This represented a long opportunity on the 30 year bond, as a trader you could have netted about 15 ticks per contract on this trade. Each tick is worth $31.25. We added a Donchian Channel to the charts to show the signals more clearly. Please note that the front month for the ZB contract is now September, 2017.
Charts Courtesy of Trend Following Trades built on a NinjaTrader platform Click on an image to enlarge it.
Bias
Yesterday we gave the markets a downside bias and the markets followed suite as the Dow dropped 13 points, the S&P dropped 1 but the Nasdaq gained 3. Today we aren’t dealing with a correlated market however our bias is to the upside.
Could this change? Of Course. Remember anything can happen in a volatile market.
Commentary
Yesterday we gave the markets a downside bias as (once again) the USD, Bonds and Gold were all trading higher yesterday morning and this does not bode well for an upside day hence the downside bias. In other news it was announced that the GOP unwrapped the proposed Senate version of the Healthcare bill which is reputed to be less harsh than the House version passed earlier this year. All the details haven’t been released as of yet but the Senate Majority Leader Mitch McConnell wants a vote on this bill prior to the Fourth of July holiday. Apparently he attempting to get something passed so the GOP can claim that they finally destroyed Obamacare.
Author

Nick Mastrandrea
Market Tea Leaves


