HealthCare Bill – DOA
US Dollar: Jun. USD is Down at 98.920.
Energies: May Crude is Down at 47.60.
Financials: The June 30 year bond is Up 28 ticks and trading at 151.31.
Indices: The June S&P 500 emini ES contract is 92 ticks Lower and trading at 2321.75.
Gold: The April gold contract is trading Up at 1258.60. Gold is 101 ticks Higher than its close.
Initial Conclusion
This is not a correlated market. The dollar is Down- and crude is Down- which is not normal but the 30 year bond is trading Higher. The Financials should always correlate with the US dollar such that if the dollar is lower then bonds should follow and vice-versa. The indices are Down and Crude is trading Down which is not correlated. Gold is trading Up which is correlated with the US dollar trading Down. I tend to believe that Gold has an inverse relationship with the US Dollar as when the US Dollar is down, Gold tends to rise in value and vice-versa. Think of it as a seesaw, when one is up the other should be down. I point this out to you to make you aware that when we don’t have a correlated market, it means something is wrong. As traders you need to be aware of this and proceed with your eyes wide open.
At this hour all of Asia is trading Lower. Currently Europe is trading Lower as well.
Possible Challenges To Traders Today
– FOMC Member Evans Speaks at 1:15 PM EST. This is major.
– FOMC Member Kaplan Speaks at 6:30 PM. This is major.
– No major economic news to speak of.
– Lack of major economic news.
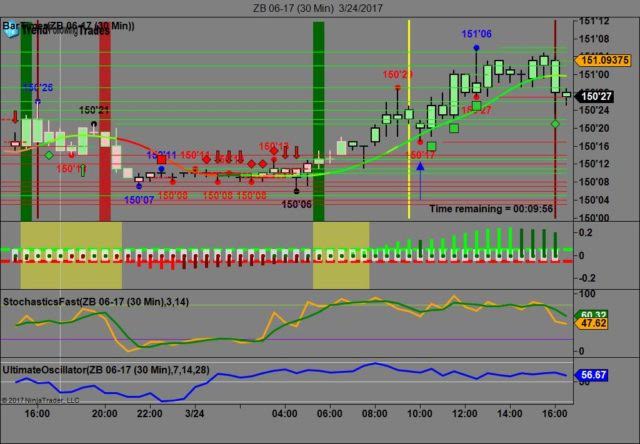
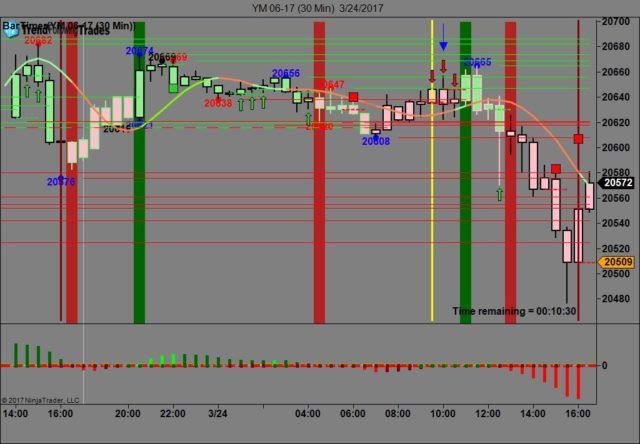
Treasuries
We’ve elected to switch gears a bit and show correlation between the 30 year bond (ZB) and The YM futures contract. The YM contract is the DJIA and the purpose is to show reverse correlation between the two instruments. Remember it’s liken to a seesaw, when up goes up the other should go down and vice versa.
On Friday the ZB made it’s move at around 10 AM after the economic news was reported. The ZB hit a low at around that time and the YM hit a high. If you look at the charts below ZB gave a signal at around 10 AM and the YM was moving lower at the same time. Look at the charts below and you’ll see a pattern for both assets. ZB hit a low at around 10 AM and the YM hit a high. These charts represent the newest version of Trend Following Trades and I’ve changed the timeframe to a 30 minute chart to display better. This represented a long opportunity on the 30 year bond, as a trader you could have netted about 20 plus ticks per contract on this trade. Each tick is worth $31.25. We added a Donchian Channel to the charts to show the signals more clearly.
Charts Courtesy of Trend Following Trades built on a NinjaTrader platform.
Bias
On Friday we gave the markets a neutral bias as the markets was awaiting news from DC. The Dow dropped 60 points, the S&P dropped 2 and the Nasdaq gained 11. Today we aren’t dealing with a correlated markets and our bias is to the downside.
Could this change? Of Course. Remember anything can happen in a volatile market.
Commentary
By now you’ve all heard the news that the House of Representatives dropped the HealthCare bill as there wasn’t enough Republican votes to achieve passage. Of course the President is blaming the Democrats for lack of participation. I wonder what this President is thinking? Does he really think the Democrats are going to support a bill that guarantees higher premium payments with a surefire loss of insurance for millions? This loss was a lack of agreement amongst the GOP members of Congress. The Freedom Caucus aka former Tea Party couldn’t support this bill because they felt it was Obamacare “light” and the moderates couldn’t support it because they knew millions would lose coverage. This is what happens when you hire inexperienced people to run government. It sounds good initially but as time goes on their inexperience is costing the country progress. Now Wall Street is concerned that any other initiative this President wants to undertake will down in flames. This recent rally was predicated on Trump getting things done: tax cuts, infrastructure, etc. and now it looks like this may not happen.
Author

Nick Mastrandrea
Market Tea Leaves


