Head & Shoulders – Would it Work on Bitcoin?

Head & Shoulders (H&S) – this is a formation that consists of three local highs – the left shoulder, the head and the right shoulder. This pattern belongs to one of the most reliable and its confirmation is to breaking the neck line. The potential range of declines determines the distance from the head level to the neck. Because it is a trend reversal formation and on the market we can have both a change from an upward trend to a downtrend as well as from a downward trend to an upward trend, this formation has its opposite form (inverted H&S).
Last year, in one of the publications, I read that the percentage efficiency of H&S formation is as high as 84% and iH&S – 82%. In that comparison they were the most effective formations, and since the statistics were calculated on the basis of the analysis of 50 currency pairs, and as many as 737 patterns (620 correct) were found for H&S and 718 patterns (590 correct) in case of inverted H&S, test can be treated as reliable.
But does H&S formation works for all instruments? Does it apply to digital currency?
At a time when cryptocurrencies are relatively a new financial instrument and their dynamic growth is perpetuating the price to new historical maximum, it seems likely that defining the key levels of resistance around which this rally to the north could end or at least stop for this moment is almost impossible. On one hand we lack the left side of the chart, which we could rely on in technical analysis, and on the other hand, for several months we have been watching the race of analysts and people involved in the digital currency environment, who are betting in higher and higher projections of future Bitcoin value.
This all stimulates the imagination as more and more people believe that sky is the limit. No matter where the price of the most popular digital currency will finally reach, the chart can see some dependencies that make the crypto move in a very technical way. I skip here the precisely tests of technical levels in the past, which I have already written many times.
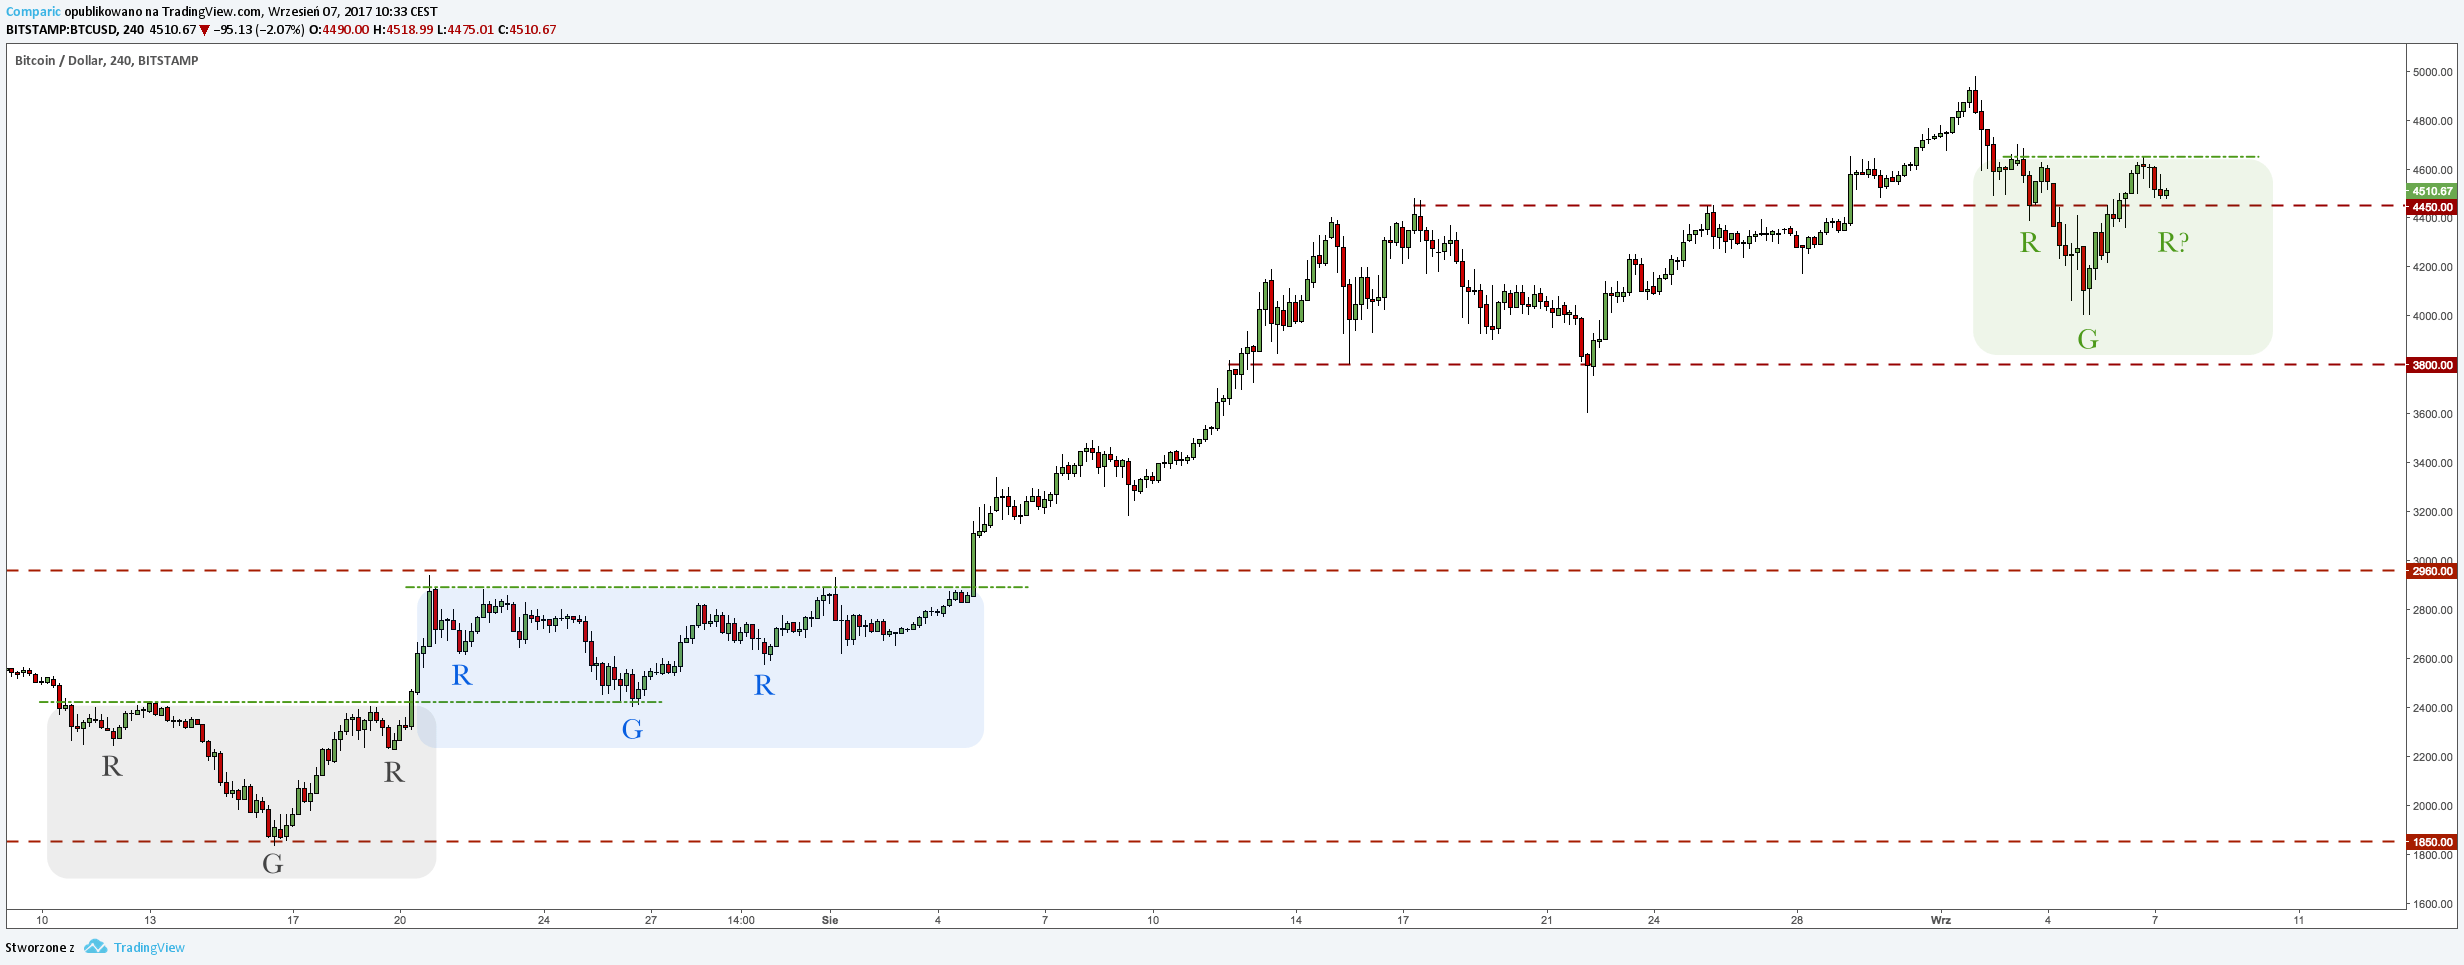
Referring to the introduction of this article, I would like to pay special attention to the formation of the iH&S formed during the last rally. Two of them have already been confirmed and realized and now we are perhaps witnessing forming of the right arm of the next formation. To confirm inverted H&S, we would still need to break the neck line. Responding to the question given on the beginning of the topic, we can without doubt answer it. Inverted Head & Shoulders formation is also effective in case of cryptocurrencies.
Author

Arkadiusz Jóźwiak
Comparic
Active on Forex since 2012. Started with commodities, now he is an active Forex trader.


