Have we peaked yet? [Video]
![Have we peaked yet? [Video]](https://editorial.fxstreet.com/images/Markets/Commodities/Metals/Gold/safe-investment-gm147322399-17568598_XtraLarge.jpg)
US Dollar: June USD is Down at 100.565.
Energies: May'20 Crude Up at 27.00.
Financials: The June'20 30 year bond is Down 47 ticks and trading at 179.03.
Indices: The June S&P 500 emini ES contract is 256 ticks Higher and trading at 2708.50.
Gold: The June '20 Gold contract is trading Up at 1704.00. Gold is 101 ticks Higher than its close.
Initial Conclusion
This is not a correlated market. The dollar is Down- and Crude is Up+ which is normal and the 30 year Bond is trading Lower. The Financials should always correlate with the US dollar such that if the dollar is lower then bonds should follow and vice-versa. The S&P is Higher and Crude is trading Higher which is not correlated. Gold is trading Higher which is correlated with the US dollar trading Up. I tend to believe that Gold has an inverse relationship with the US Dollar as when the US Dollar is down, Gold tends to rise in value and vice-versa. Think of it as a seesaw, when one is up the other should be down. I point this out to you to make you aware that when we don't have a correlated market, it means something is wrong. As traders you need to be aware of this and proceed with your eyes wide open.
At this time all of Asia is trading Higher. Currently all of Europe is trading Higher as well.
Possible Challenges To Traders Today:
-
JOLTS Job Openings is out at 10 AM EST. This is Major.
-
IBD/TIPP Economic Optimism. This is Major.
-
Ten Year Bond Auction Starts at 1 PM EST. Major.
-
Consumer Credit is out at 3 PM EST. This is Major.
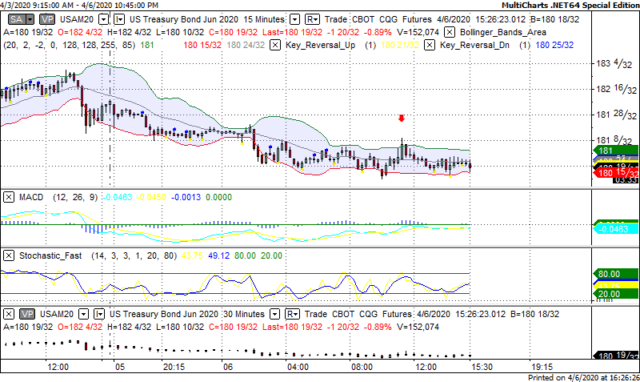
Treasuries
We've elected to switch gears a bit and show correlation between the 30 year bond (ZB) and The S&P futures contract. The S&P contract is the Standard and Poor's and the purpose is to show reverse correlation between the two instruments. Remember it's liken to a seesaw, when up goes up the other should go down and vice versa.
Yesterday the ZB made a move at around 11:15 AM EST. The ZB hit a High at around that time and the S&P moved Higher. If you look at the charts below ZB gave a signal at around 11:15 AM and the S&P moved Higher at around the same time. Look at the charts below and you'll see a pattern for both assets. ZB hit a High at around 11:15 AM EST and the S&P was moving Lower shortly thereafter. These charts represent the newest version of MultiCharts and I've changed the timeframe to a 15 minute chart to display better. This represented a Shorting opportunity on the 30 year bond, as a trader you could have netted 30 ticks per contract on this trade. Each tick is worth $31.25. Please note: the front month for the ZB is now June '20. The S&P contract is now June '20 as well. I've changed the format to Renko bars such that it may be more apparent and visible.
Charts Courtesy of MultiCharts built on an AMP platform
Bias
Yesterday we gave the markets an Upside bias as both crude and the bonds were trading Lower and this is indicative of an Upside day. The markets didn't disappoint as the Dow gained 1,627 points and the other indices gained ground as well. Today we aren't dealing with a correlated market and our bias is to the Upside.
Could this change? Of Course. Remember anything can happen in a volatile market.
Commentary
On Sunday evening the White House scheduled their daily coronavirus update meeting where it was announced that certain aspects have shown the virus meeting its peak in New York. Both Governor Cuomo and Mayor Di Blasi poo pooed this idea as the virus doesn't shown any signs of weakening yet but this could change. The death count unfortunately goes higher each day. We are hoping that in fact the virus will weaken shortly but as in all things only time will tell.
Author

Nick Mastrandrea
Market Tea Leaves


