Don't expect Gold price to rally in the long-term, it's more likely to decline

We were recently asked to comment on Harry Dent’s predictions for the Gold market and we thought that our reply might benefit other gold investors as well. To be precise, we were asked about Harry Dent’s 30-year cycle that supposedly peaked in 2011, and we supposedly could expect gold to peak again somewhere between 2038 and 2040 (you can watch the interview here). The indirect implication is that gold is not likely to soar sooner and that it’s likely to decline for a relatively long time.
Mr. Dent is referring to Gold as a premier commodity and he claims that it moves up and down with the commodity cycle, which, in his opinion, is 30 years.
If the above is really the case, then the previous prediction may be well founded. But is it really so?
We respectfully disagree for two reasons.
The first reason is fundamental. Gold’s price reacts more to flows of gold than to mining supply and demand and thus it behaves more like a currency than a commodity. So, from the fundamental point of view, it may not be justified to view gold simply as a commodity (even a premier one).
The second reason is… Simply checking the facts and the facts confirm our thesis from the above paragraph, invalidating Mr. Dent’s claim that gold moves in a 30-year cycle.
The price of gold was fixed for most of history, so it’s impossible to analyze this cycle directly. No, that’s not our case against the theory. Our case is that we can use the best proxy that we have for the price of gold. The price of gold was fixed, but the prices of gold stocks were not and since the major tops and bottoms in both asset classes correspond to each other, gold miners could be used to check what gold could have done. The gold stocks ratio to the general stock market is even better because by using it we are taking out the part of the mining stocks’ price movement that depends on the stock market volatility.
Let’s check if this is indeed the case with the HUI to S&P 500 ratio (chart courtesy of http://stockcharts.com).
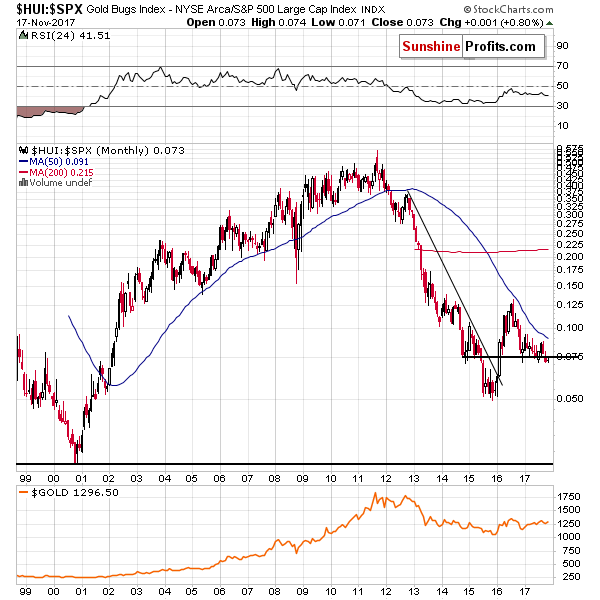
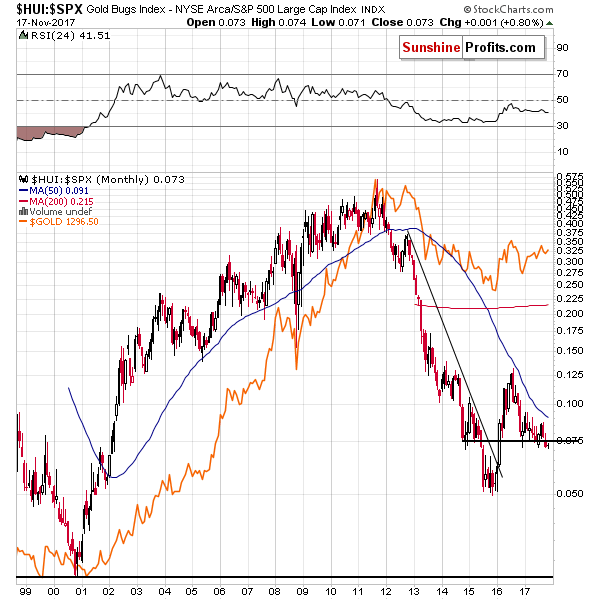
The above charts show the same ratio over the same time-span and they differ only in terms of scale. Since the link between the HUI to S&P ratio and gold is clearly visible in both linear and logarithmic terms, we can safely assume that our earlier assumption of using gold miners and their ratio as a proxy for gold was correct.
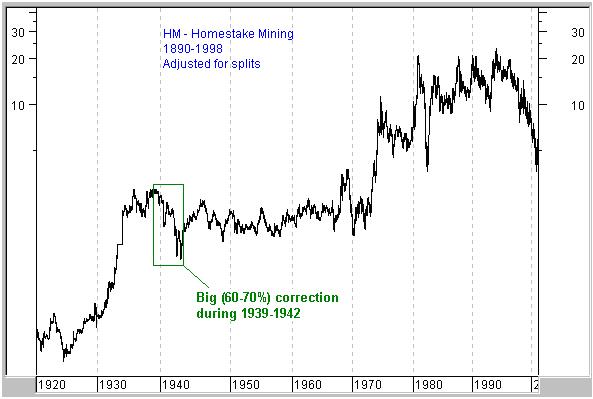
Unfortunately, we can’t use the HUI Index and its ratio in the case of the very long-term analysis as it wasn’t trading just a few decades ago. The gold stock that was trading and that we will use as a proxy for the entire sector (in light of lack of other alternatives) is Homestake Mining.
Can we observe a 30-year cycle in Homestake Mining prices and/or its ratio to the general stock market?
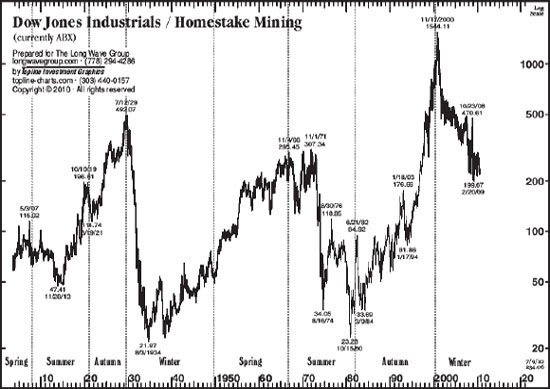
The bottoms in the ratio (second chart) are the moments when we can speak of “artificial tops” in gold. The 2011 top and the 1980 top were seen in gold directly and the only (!) addition that the above chart provides us with is the mid-1930s extreme.
We can see exactly the same thing on the chart featuring Homestake Mining directly. There was a major, long-term top in mid-1930s and then nothing extreme happened until 1980 with the exception of interim tops in the late 1960s and mid-1970s
About 30 years passed from the 1980 top to 2011, but that’s it as far as the confirmations of the 30-year old cycle go and a cycle with only one occurrence is no cycle. The timespan between the 1980 top and the previous one is about 45 years, which is exactly between 2 supposed topping dates (that should be 30 and 60 years away). In other words, the mid-1930s observation couldn’t invalidate the 30-year cycle theory more than it already does.
On a side note, since gold topped in early 1980, taking the 30-year cycle and applying it to the letter would make one sell gold in early 2010 – more or less when gold was trading around $1,100, right before the biggest rally of the bull market.
Summing up, it doesn’t seem that gold is just a premier commodity as it’s price doesn’t seem to follow the 30-year cycle. Consequently, it doesn’t seem to be justified to expect gold to form the next big top between 2038 and 2040 – it could and is likely to rally much sooner. The above doesn’t mean that gold will not decline in the following months, but it does imply that one shouldn’t bet on a multi-year long decline in the prices of yellow metal. Therefore, when gold slides sharply, it is likely to serve as an epic buying opportunity – not the start of a boring, multi-year consolidation.
If you’d like to receive follow-ups to the above analysis, we invite you to sign up to our gold newsletter. You’ll receive our articles for free and if you don’t like them, you can unsubscribe in just a few seconds. Sign up today.
Want free follow-ups to the above article and details not available to 99%+ investors? Sign up to our free newsletter today!
Author

Przemyslaw Radomski, CFA
Sunshine Profits
Przemyslaw Radomski, CFA (PR) is a precious metals investor and analyst who takes advantage of the emotionality on the markets, and invites you to do the same. His company, Sunshine Profits, publishes analytical software that any


