Happy V Day

Good Morning Traders,
As of this writing 5 AM EST, here's what we see:
US Dollar: March USD is Up at 97.015.
Energies: March '19 Crude is Up at 54.44.
Financials: The Mar 30 year bond is Up 6 ticks and trading at 145.30.
Indices: The Mar S&P 500 emini ES contract is 22 ticks Higher and trading at 2757.00.
Gold: The Feb Gold contract is trading Down at 1309.10. Gold is 60 ticks Lower than its close.
Initial Conclusion
This is not a correlated market. The dollar is Up+ and Crude is Up+ which is not normal and the 30 year Bond is trading Higher as well. The Financials should always correlate with the US dollar such that if the dollar is lower then bonds should follow and vice-versa. The S&P is Higher and Crude is trading Higher which is not correlated. Gold is trading Lower which is correlated with the US dollar trading Higher. I tend to believe that Gold has an inverse relationship with the US Dollar as when the US Dollar is down, Gold tends to rise in value and vice-versa. Think of it as a seesaw, when one is up the other should be down. I point this out to you to make you aware that when we don't have a correlated market, it means something is wrong. As traders you need to be aware of this and proceed with your eyes wide open.
At this hour all of Asia is trading Lower with the exception of the Singapore exchange which is fractionally Higher. Currently Europe is trading Higher with the exception of the Milan exchange which is trading Lower.
Possible Challenges To Traders Today
-
Retail Sales is out at 8:30 AM EST. This is major.
-
Core Retail Sales is out at 8:30 AM EST. This is major.
-
PPI is out at 8:30 AM EST. This is major.
-
Core PPI is out at 8:30 AM EST. This is major.
-
Unemployment Claims is out at 8:30 AM EST. Major
-
Business Inventories are out at 10 AM EST. This is major.
-
Natural Gas Storage is out at 10:30 AM EST. This is major.
-
Mortgage Delinquencies - tentative. This is major.
Treasuries
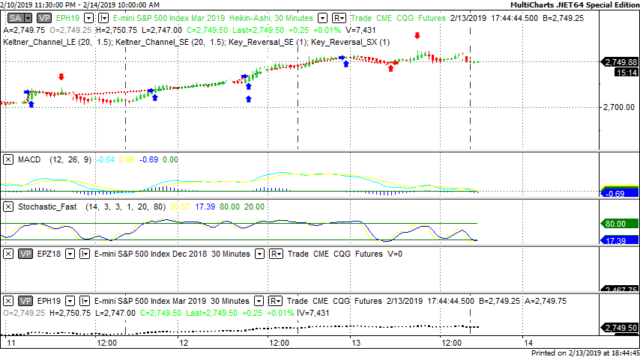
We've elected to switch gears a bit and show correlation between the 30 year bond (ZB) and The YM futures contract. The YM contract is the DJIA and the purpose is to show reverse correlation between the two instruments. Remember it's liken to a seesaw, when up goes up the other should go down and vice versa.
Yesterday the ZB made a major move at around 9 AM EST. The ZB hit a Low at around that time and the YM hit a High. If you look at the charts below ZB gave a signal at around 9 AM EST and the YM was moving Lower at the same time. Look at the charts below and you'll see a pattern for both assets. ZB hit a Low at around 9 AM and the YM was moving Lower at the same time. These charts represent the newest version of MultiCharts and I've changed the timeframe to a 30 minute chart to display better. This represented a Long opportunity on the 30 year bond, as a trader you could have netted about a dozen ticks per contract on this trade. Each tick is worth $31.25. Please note: the front month for the ZB contract is now March, 2019
Charts Courtesy of MultiCharts built on an AMP platform

Bias
Yesterday we gave the markets a Downside bias as both the USD and the Bonds were trading Higher Wednesday morning. The markets however had other ideas as the Dow gained 118 points and the other indices gained ground as well although fractionally. Today we aren't dealing with a correlated market and our bias is Neutral.
Could this change? Of Course. Remember anything can happen in a volatile market.
Commentary
Yesterday morning we gave the markets a Downside bias but perhaps we should have given a Neutral bias however the USD and the Bonds were trading Higher and that usually reflects a downside day. What changed? News that an impending trade deal with China may be consummated. That kind of news has the ability to turn the markets around as it did yesterday. Today we have 8 economic reports all of which are major.. On a lighter note, please don't forget that today is Valentines Day and your romantic interest is expecting something so don't disappoint them.
Author

Nick Mastrandrea
Market Tea Leaves


