Happy Thanksgiving [Video]
![Happy Thanksgiving [Video]](https://editorial.fxstreet.com/images/Macroeconomics/Events/Thanksgiving/family-celebration-75244813_XtraLarge.jpg)
US Dollar: Dec '21 USD is Up at 96.710.
Energies: Jan '22 Crude is Down at 78.33.
Financials: The Dec '21 30 Year bond is Up 11 ticks and trading at 159.23.
Indices: The Dec '21 S&P 500 emini ES contract is 52 ticks Lower and trading at 4675.50.
Gold: The Dec'21 Gold contract is trading Up at 1789.20. Gold is 54 ticks Higher than its close.
Initial conclusion
This is nearly correlated market. The dollar is Up and Crude is Down which is normal and the 30-year Bond is trading Higher. The Financials should always correlate with the US dollar such that if the dollar is lower then the bonds should follow and vice-versa. The S&P is Lower and Crude is trading Lower which is not correlated. Gold is trading Lower which is correlated with the US dollar trading Up. I tend to believe that Gold has an inverse relationship with the US Dollar as when the US Dollar is down, Gold tends to rise in value and vice-versa. Think of it as a seesaw, when one is up the other should be down. I point this out to you to make you aware that when we don't have a correlated market, it means something is wrong. As traders, you need to be aware of this and proceed with your eyes wide open. Currently, Asia is trading mainly Lower with the exception of the Hang Seng and Shanghai exchanges which are Higher at this time. All of Europe is trading Lower at this time with the exception of the London exchange which is fractionally Higher.
Possible challenges to traders today
-
Prelim GDP is out at 8:30 AM EST. This is Major.
-
Core Durable Goods Orders is out at 8:30 AM EST. Major.
-
Durable Goods Orders is out at 8:30 AM EST. Major.
-
Unemployment Claims is out at 8:30 AM EST. This is Major.
-
Goods Trade Balance is out at 8:30 AM EST. Major.
-
Prelim GDP Price Index is out at 8:30 AM EST. Major.
-
Prelim Wholesale Inventories is out at 8:30 AM. Not Major.
-
Core PCE Price Index is out at 10 AM EST. Major.
-
Revised UoM Consumer Sentiment is out at 10 AM. Not Major.
-
Revised UoM Inflation Expectations is out at 10 AM EST. Not Major.
-
New Home Sales is out at 10 AM EST. This is Major.
-
Personal Income is out at 10 AM EST. This is Major.
-
Personal Spending is out at 10 AM EST. This is Major.
-
Crude Oil Inventories is out at 10:30 AM EST. Major.
-
Natural Gas Storage is out at 11 AM EST. Major.
-
FOMC Meeting Minutes is out at 2 PM EST. This is Major.
Treasuries
Traders please note that we've changed the Bond instrument from the 30 year (ZB) to the 10 year (ZN). They work exactly the same.
We've elected to switch gears a bit and show correlation between the 10-year bond (ZN) and the S&P futures contract. The S&P contract is the Standard and Poor's and the purpose is to show reverse correlation between the two instruments. Remember it's likened to a seesaw, when up goes up the other should go down and vice versa.
Yesterday the ZN made its move at around 8 AM EST. The ZN hit a Low at around that time and the S&P moved Lower. If you look at the charts below ZN gave a signal at around 8 AM EST and the S&P moved Lower at around the same time. Look at the charts below and you'll see a pattern for both assets. ZN hit a Low at around 8 AM EST and the S&P was moving Lower shortly thereafter. These charts represent the newest version of MultiCharts and I've changed the timeframe to a 15-minute chart to display better. This represented a Long opportunity on the 10-year note, as a trader you could have netted about 15 ticks per contract on this trade. Each tick is worth $15.625. Please note: the front month for the ZN is now Dec '21. The S&P contract is now Dec '21 as well. I've changed the format to Renko bars such that it may be more apparent and visible.
Charts Courtesy of MultiCharts built on an AMP platform
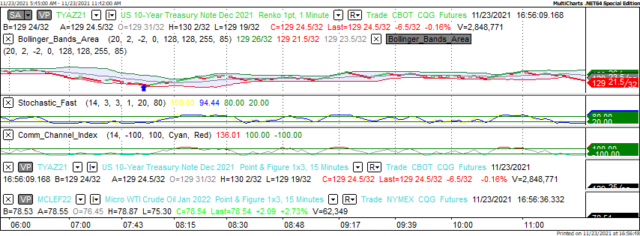
ZN - Dec 2021 - 11/23/21
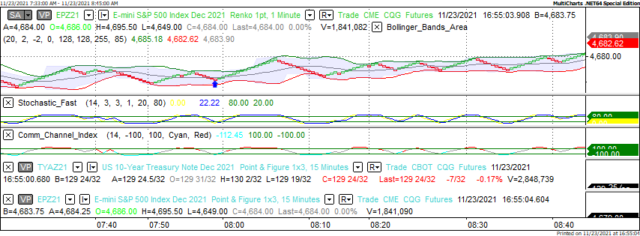
S&P - Dec 2021 - 11/23/21
Bias
Yesterday we gave the markets a Neutral bias but the Dow traded 195 points Higher, the S&P closed 8 points Higher but the Nasdaq dropped 80 points. All in all, a Mixed or Neutral day. Today we are dealing with a nearly correlated market and it's correlated to the Downside. Hence our bias is to the Downside.
Could this change? Of Course. Remember anything can happen in a volatile market.
Commentary
So yesterday we heard an announcement that the President has (finally) decided to release 50 million barrels of crude from the SPR (Strategic Petroleum Reserve) yet the price of oil closed Higher, why? OPEC has decided to stay the course and not alter their current plans. They will not increase production beyond its current level. The time to do this was probably about two weeks ago, not now. On a lighter note, today we have about 16 economic reports and I believe that's the most I've ever seen in one day's time since starting this newsletter. It is also Thanksgiving weekend, a time to rflect on the positive things we have to be grateful for. It's been a rough two years for all of us but we have to admit that there are things to be grateful for. The markets will be closed tomorrow and have an abbreviated session on Friday, November 25. We will be back on Monday, November 29. Happy Thanksgiving to all.
Author

Nick Mastrandrea
Market Tea Leaves


