Happy Thanksgiving

Good Morning Traders,
As of this writing 4 AM EST, here’s what we see:
US Dollar: Dec. USD is Down at 93.685.
Energies: Jan ’18 Crude is Up at 57.87.
Financials: The Dec 30 year bond is Up 4 ticks and trading at 154.07.
Indices: The Dec S&P 500 emini ES contract is 4 ticks Higher and trading at 2597.25.
Gold: The Dec gold contract is trading Up at 1284.70. Gold is 30 ticks Higher than its close.
Initial Conclusion
This is not a correlated market. The dollar is Down- and Crude is Up+ which is normal but the 30 year Bond is trading Higher. The Financials should always correlate with the US dollar such that if the dollar is lower then bonds should follow and vice-versa. The indices are Higher and Crude is trading Up+ which is not correlated. Gold is trading Up which is correlated with the US dollar trading Down-. I tend to believe that Gold has an inverse relationship with the US Dollar as when the US Dollar is down, Gold tends to rise in value and vice-versa. Think of it as a seesaw, when one is up the other should be down. I point this out to you to make you aware that when we don’t have a correlated market, it means something is wrong. As traders you need to be aware of this and proceed with your eyes wide open.
At this hour all of Asia is trading Higher. As of this writing Europe is trading Mixed with half the exchanges Higher and the other half Lower.
Possible Challenges To Traders Today
-
Durable Goods Orders is out at 8:30 AM EST. This is major.
-
Core Durable Goods is out at 8:30 AM EST. This is major.
-
Unemployment Claims are out at 8:30 AM EST. This is major.
-
Revised UoM Consumer Sentiment is out at 10 AM. This is not major.
-
Revised UoM Inflation Expectations is out at 10 AM. This is not major.
-
Crude Oil Inventories is out at 10:30 AM EST. This is major.
-
Natural Gas Storage is out at 12 PM EST. This is major.
-
FOMC Meeting Minutes are out at 2 PM EST. This is major.
Treasuries
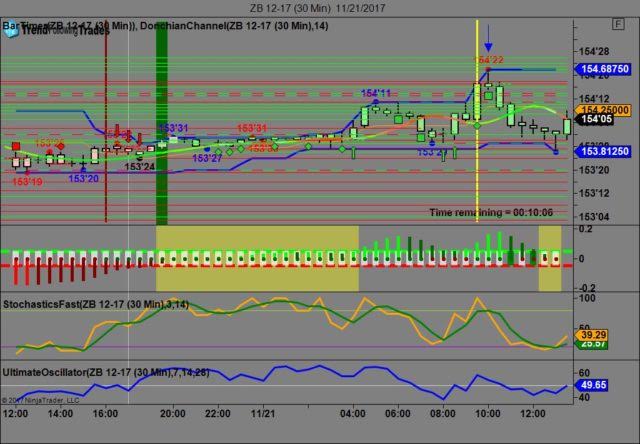
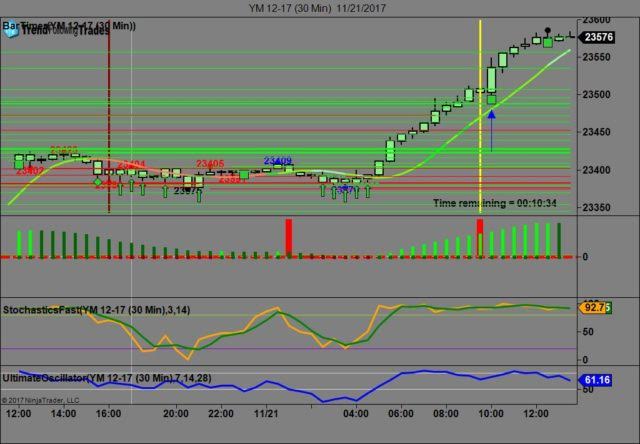
We’ve elected to switch gears a bit and show correlation between the 30 year bond (ZB) and The YM futures contract. The YM contract is the DJIA and the purpose is to show reverse correlation between the two instruments. Remember it’s liken to a seesaw, when up goes up the other should go down and vice versa.
Yesterday the ZB made it’s move at around 10 AM EST. The ZB hit a High at around that time and the YM hit a Low. If you look at the charts below ZB gave a signal at around 10 AM EST and the YM was moving Higher at the same time. Look at the charts below and you’ll see a pattern for both assets. ZB hit a High at around 10 AM and the YM hit a Low. These charts represent the newest version of Trend Following Trades and I’ve changed the timeframe to a 30 minute chart to display better. This represented a Shorting opportunity on the 30 year bond, as a trader you could have netted about 20 ticks per contract on this trade. Each tick is worth $31.25. We added a Donchian Channel to the charts to show the signals more clearly. Please note that the front month for the ZB and the YM contract is now December, 2017.
Charts Courtesy of Trend Following Trades built on a NinjaTrader platform.
Bias
Yesterday we called for a Downside bias as Crude, the Bonds and Gold were all trading higher yesterday morning and this usually signifies a downside day. The markets however had other ideas as the Dow rose 161 points and the other indices gained ground as well. Today we aren’t dealing with a correlated market and our bias is Neutral.
Could this change? Of Course. Remember anything can happen in a volatile market.
Commentary
Once again it seems as though the markets are in a tug of war in terms of direction as yesterday morning it seemed as though the markets should have trended lower but didn’t. The markets traded higher and today we have a mini tsunami in terms of economic reports. Given that tomorrow is Thanksgiving many reports slated for Thursday will now be released today instead. On a personal note, we all have reasons to be grateful. We wish all of you a very Happy Thanksgiving!!!!!!
Author

Nick Mastrandrea
Market Tea Leaves


