Happy Easter [Video]
![Happy Easter [Video]](https://editorial.fxstreet.com/images/Markets/Currencies/Majors/DollarIndex/us-currency-with-one-quarter-coins-50559936_XtraLarge.jpg)
US Dollar: June USD is Down at 100.010.
Energies: May'20 Crude Up at 26.58.
Financials: The June'20 30 year bond is Up 11 ticks and trading at 178.20.
Indices: The June S&P 500 emini ES contract is 32 ticks Lower and trading at 2727.00.
Gold: The June '20 Gold contract is trading Up at 1703.20. Gold is 189 ticks Higher than its close.
Initial Conclusion
This is not a correlated market. The dollar is Down- and Crude is Up+ which is normal but the 30 year Bond is trading Higher. The Financials should always correlate with the US dollar such that if the dollar is lower then bonds should follow and vice-versa. The S&P is Lower and Crude is trading Higher which is correlated. Gold is trading Higher which is correlated with the US dollar trading Down. I tend to believe that Gold has an inverse relationship with the US Dollar as when the US Dollar is down, Gold tends to rise in value and vice-versa. Think of it as a seesaw, when one is up the other should be down. I point this out to you to make you aware that when we don't have a correlated market, it means something is wrong. As traders you need to be aware of this and proceed with your eyes wide open.
At this time all of Asia is trading mainly Higher with the exception of the Nikkei exchange which is Lower. Currently Europe is trading Mixed.
Possible Challenges To Traders Today:
-
Unemployment Claims are out at 8:30 AM EST. This is Major.
-
PPI is out at 8:30 AM EST. This is Major.
-
Core PPI is out at 8:30 AM EST. This is Major.
-
Fed Chair Powell Speaks at 10 AM EST. This is Major.
-
Prelim UoM Consumer Sentiment is out at 10 AM EST. This is Major.
-
Prelim UoM Inflation Expectations is out at 10 AM EST. This is Major.
-
Final Wholesale Inventories is out at 10 AM EST. This is not Major.
-
Natural Gas Storage is out at 10:30 AM EST. This is Major.
Treasuries
We've elected to switch gears a bit and show correlation between the 30 year bond (ZB) and The S&P futures contract. The S&P contract is the Standard and Poor's and the purpose is to show reverse correlation between the two instruments. Remember it's liken to a seesaw, when up goes up the other should go down and vice versa.
Yesterday the ZB made a move at around 10 AM EST. The ZB hit a High at around that time and the S&P moved Higher. If you look at the charts below ZB gave a signal at around 10 AM and the S&P moved Higher at around the same time. Look at the charts below and you'll see a pattern for both assets. ZB hit a High at around 10 AM EST and the S&P was moving Higher shortly thereafter. These charts represent the newest version of MultiCharts and I've changed the timeframe to a 15 minute chart to display better. This represented a Shorting opportunity on the 30 year bond, as a trader you could have netted 30 plus ticks per contract on this trade. Each tick is worth $31.25. Please note: the front month for the ZB is now June '20. The S&P contract is now June '20 as well. I've changed the format to Renko bars such that it may be more apparent and visible.
Charts Courtesy of MultiCharts built on an AMP platform
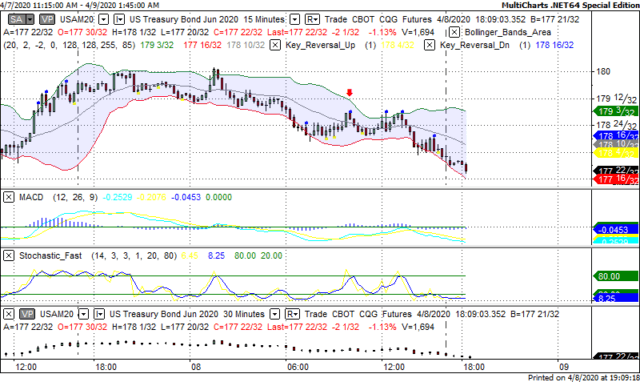
ZB - June 2020 - 4/8/20
-637220262994901698.png)
SP June 2020 - 4/8/20
Bias
Yesterday we gave the markets a Neutral bias as we didn't see much evidence in the way of Market Correlation. What we saw was instruments flip flopping between positive and negative territory. Today we aren't dealing with a correlated market and our bias is Neutral.
Could this change? Of Course. Remember anything can happen in a volatile market.
Commentary
Yesterday morning we witnessed various instruments flip flopping between positive and negative territory. We didn't see any firm conviction in terms of Market Correlation hence the Neutral bias. For those of you who are new to us, a Neutral bias means the markets could go in any direction and often does. The Dow gained 780 points and the other indices gained ground as well. Today is the last trading day prior to Easter Sunday as tomorrow is Good Friday and the markets are closed until Monday, April 12. Given that it is the Easter Holiday let's try to give thanks for all we have regardless of how small it is. We'll be back on Monday, have a safe and Happy Holiday!!!
Author

Nick Mastrandrea
Market Tea Leaves


