Happy Easter

US Dollar: Jun '23 USD is Up at 101.625.
Energies: May '23 Crude is Down at 80.50.
Financials: The Jun '23 30 Year T-Bond is Down 4 ticks and trading at 133.30.
Indices: The Jun '23 S&P 500 emini ES contract is 10 ticks Lower and trading at 4114.25.
Gold: The Apr'23 Gold contract is trading Down at 2034.50. Gold is 11 ticks Lower than its close.
Initial conclusion
This is not a correlated market. The USD is Up, and Crude is Down which is normal, but the 30 Year T-Bond is trading Lower. The Financials should always correlate with the US dollar such that if the dollar is Higher, then the bonds should follow and vice-versa. The S&P is Lower, and Crude is trading Lower which is not correlated. Gold is trading Lower which is correlated with the US dollar trading Up. I tend to believe that Gold has an inverse relationship with the US Dollar as when the US Dollar is down, Gold tends to rise in value and vice-versa. Think of it as a seesaw, when one is up the other should be down. I point this out to you to make you aware that when we don't have a correlated market, it means something is wrong. As traders you need to be aware of this and proceed with your eyes wide open. At the present time Asia is trading Mixed with half the exchanges Higher and the other half Lower. Currently all of Europe is trading Higher. .
Possible challenges to traders today
-
Unemployment Claims are out at 8:30 AM EST. This is Major.
-
Natural Gas Storage is out at 10:30 AM EST. This is Major.
Friday, April 7th
-
Average Hourly Earnings m/m is out at 8:30 AM EST. Major.
-
Non-Farm Employment Change is out at 8:30 AM EST. Major.
-
Unemployment Rate is out at 8:30 AM EST, This is Major.
-
Consumer Credit is out at 3 PM EST. This is Major.
Please note I included Friday's economic news as the markets will be closed on Friday for the Good Friday Holiday but these news items will be released.
Treasuries
Traders, please note that we've changed the Bond instrument from the 30 year (ZB) to the 10 year (ZN). They work exactly the same.
We've elected to switch gears a bit and show correlation between the 10-year bond (ZN) and the S&P futures contract. The S&P contract is the Standard and Poor's, and the purpose is to show reverse correlation between the two instruments. Remember it's likened to a seesaw, when up goes up the other should go down and vice versa.
Yesterday the ZN hit a Low at around 10 AM EST but at the same time the S&P hit a High. If you look at the charts below the ZN gave a signal at around 10 AM and the ZN continued its Upward trend. Look at the charts below and you'll see a pattern for both assets. S&P hit a High at around 10 AM and migrated Lower. These charts represent the newest version of MultiCharts and I've changed the timeframe to a 15-minute chart to display better. This represented a Long opportunity on the 10-year note, as a trader you could have netted about 25 ticks per contract on this trade. Each tick is worth $15.625. Please note: the front month for the ZN is now Jun '23. The S&P contract is also Jun' 23. I've changed the format to filled Candlesticks (not hollow) such that it may be more apparent and visible.
Charts courtesy of MultiCharts built on an AMP platform
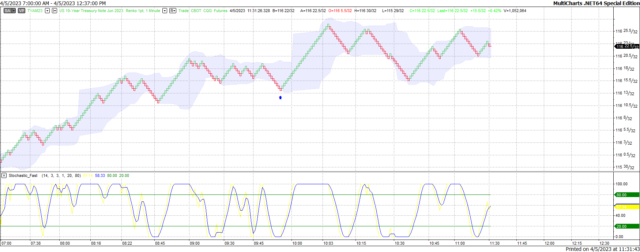
ZN - Jun 2023 - 4/5/23
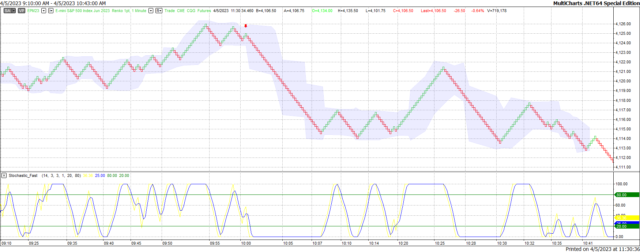
S&P - Jun 2023 - 4/5/23
Bias
Yesterday we gave the markets a Neutral or Mixed bias as the indices was correlated that way. The markets didn't disappoint as the Dow traded Higher by 80 points but the other indices lost ground. All in all a Neutral or Mixed Day. Today we aren't dealing with a correlated market and our bias is Neutral.
Could this change? Of Course. Remember anything can happen in a volatile market.
Commentary
So, it looked like the Trumpty Dumpty circus continued into Day Two as the markets traded Mixed yesterday. No sooner did the former president return to Florida when he bad mouthed everyone associated with his charges and the court proceedings. He was advised to keep silent and what does he do? He bad mouths the judge involved in this case as well as the judge's daughter and I believe his sons badmouthed the judge's wife. Someone should tell this spoiled brat that in the courtroom the judge is king, not you. In any case, today we will get Unemployment Claims and Natural Gas Storage. Tomorrow even though the markets are closed, news will be released in the form of Non-Farm Payrolls. Tomorrow is Good Friday and the start of the Easter Holiday. We will be back on Monday April 10th, and we wish all readers a safe and happy holiday.
Author

Nick Mastrandrea
Market Tea Leaves
Nick Mastrandrea over 20 years experience in trading and formerly held a NASD Series 7. He currently holds a NJ Life, Health and Variable Authority. Nick is a published writer and his work has appeared in Futures Magazine, TraderPlanet and others.


