US Dollar: June USD is Up at 96.955.

Energies: May '19 Crude is Down at 63.66.

Financials: The Jun 30 year bond is Up 14 ticks and trading at 146.24.

Indices: The June S&P 500 emini ES contract is 26 ticks Lower and trading at 2894.00.

Gold: The June Gold contract is trading Up at 1276.90.  Gold is 1 tick Higher than its close.

Initial Conclusion

This is not a correlated market.  The dollar is Up+  and Crude is Down- which is normal and the 30 year Bond is trading Higher.  The Financials should always correlate with the US dollar such that if the dollar is lower then bonds should follow and vice-versa. The S&P is Lower and Crude is trading Lower which is not correlated. Gold is trading Higher which is not correlated with the US dollar trading Up.   I tend to believe that Gold has an inverse relationship with the US Dollar as when the US Dollar is down, Gold tends to rise in value and vice-versa. Think of it as a seesaw, when one is up the other should be down. I point this out to you to make you aware that when we don't have a correlated market, it means something is wrong. As traders you need to be aware of this and proceed with your eyes wide open.

At this hour all of Asia is trading Lower. Currently all of Europe is trading Lower as well.

Possible Challenges To Traders Today

  • Core Retail Sales m/m is out at 8:30 AM EST.  This is major.

  • Retail Sales is out at 8:30 AM EST.  This is major.

  • Philly Fed Manufacturing Index is out at 8:30 AM EST.  This is major.

  • Unemployment Claims are out at 8:30 AM.  This is major.

  • Flash Manufacturing PMI is out at 9:45 AM EST.  This is major.

  • Flash Services PMI is out at 9:45 AM EST.  This is major.

  • Business Inventories m/m is out at 10 AM EST.  This is major.

  • CB Leading Index m/m is out at 10 AM EST.  This is major.

  • Natural Gas Storage is out at 10:30 AM EST.  This is major.

Treasuries

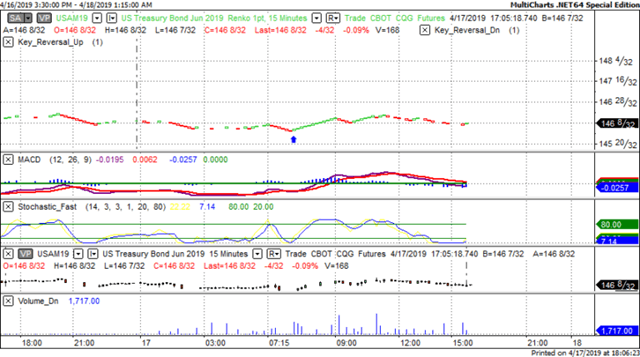
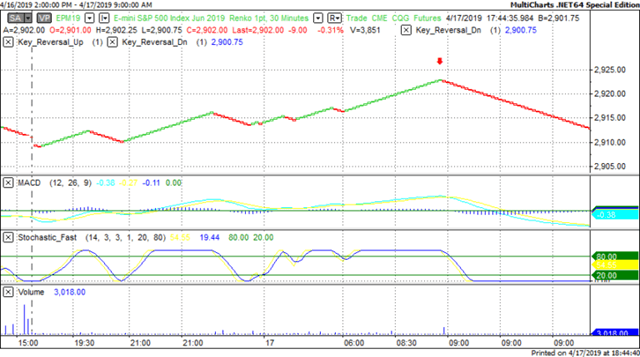
We've elected to switch gears a bit and show correlation between the 30 year bond (ZB) and The YM futures contract.  The YM contract is the DJIA and the purpose is to show reverse correlation between the two instruments.  Remember it's liken to a seesaw, when up goes up the other should go down and vice versa.

Yesterday the ZB made a major move at around 8 AM EST.  The ZB hit a Low at around that time and the YM hit a High.  If you look at the charts below ZB gave a signal at around 8 AM EST and the YM was moving Lower at the same time. Look at the charts below and you'll see a pattern for both assets. ZB hit a Low at around 8 AM and the YM was moving Lower at the same time.  These charts represent the newest version of MultiCharts and I've changed the timeframe to a 15 minute chart to display better.  This represented a Long opportunity on the 30 year bond, as a trader you could have netted about 12 ticks per contract on this trade.  Each tick is worth $31.25.  Please note: the front month for the ZB contract is now June, 2019 and I've changed the format to Renko bars such that it may be more apparent and visible.

Charts Courtesy of MultiCharts built on an AMP platform

CHART

CHART

Bias

Yesterday we gave the markets an Upside  bias and whereas most of the session was spent in positive territory, within the last few minutes of trading the indices dipped fractionally.  The Dow slipped by 3, the S&P by 7 and the Nasdaq by 4.  Today we aren't dealing with a correlated market and our bias is to the Downside.

Could this change? Of Course.  Remember anything can happen in a volatile market.

Commentary

Today is the last trading day prior to the Easter Holiday.  Tomorrow is Good Friday and the markets are closed both in the US and Europe.  Europe actually has another holiday on Monday called Easter Monday.   Wouldn't that be great if we had that here..  Today we have a virtual tsunami of economic reports that represent both today and Friday; so they'll all be released today.  There are about 9 reports, all of which are major.

Trading performance displayed herein is hypothetical. The following Commodity Futures Trading Commission (CFTC) disclaimer should be noted.

Hypothetical performance results have many inherent limitations, some of which are described below. No representation is being made that any account will or is likely to achieve profits or losses similar to those shown.

In fact, there are frequently sharp differences between hypothetical performance results and the actual results subsequently achieved by any particular trading program. One of the limitations of hypothetical performance trading results is that they are generally prepared with the benefit of hindsight.

In addition, hypothetical trading does not involve financial risk, and no hypothetical trading record can completely account for the impact of financial risk in actual trading. For example, the ability to withstand losses or to adhere to a particular trading program in spite of trading losses are material points which can also adversely affect actual trading results.

There are numerous other factors related to the markets in general or to the implementation of any specific trading program which cannot be fully accounted for in the preparation of hypothetical performance results and all of which can adversely affect actual trading results.

Trading in the commodities markets involves substantial risk and YOU CAN LOSE A LOT OF MONEY, and thus is not appropriate for everyone. You should carefully consider your financial condition before trading in these markets, and only risk capital should be used.

In addition, these markets are often liquid, making it difficult to execute orders at desired prices. Also, during periods of extreme volatility, trading in these markets may be halted due to so-called “circuit breakers” put in place by the CME to alleviate such volatility. In the event of a trading halt, it may be difficult or impossible to exit a losing position.

Recommended Content


Recommended Content

Editors’ Picks

EUR/USD holds below 1.0750 ahead of key US data

EUR/USD holds below 1.0750 ahead of key US data

EUR/USD trades in a tight range below 1.0750 in the European session on Friday. The US Dollar struggles to gather strength ahead of key PCE Price Index data, the Fed's preferred gauge of inflation, and helps the pair hold its ground. 

EUR/USD News

USD/JPY stays firm above 156.00 after BoJ Governor Ueda's comments

USD/JPY stays firm above 156.00 after BoJ Governor Ueda's comments

USD/JPY stays firm above 156.00 after surging above this level on the Bank of Japan's decision to leave the policy settings unchanged. BoJ Governor said weak Yen was not impacting prices but added that they will watch FX developments closely.

USD/JPY News

Gold price oscillates in a range as the focus remains glued to the US PCE Price Index

Gold price oscillates in a range as the focus remains glued to the US PCE Price Index

Gold price struggles to attract any meaningful buyers amid the emergence of fresh USD buying. Bets that the Fed will keep rates higher for longer amid sticky inflation help revive the USD demand.

Gold News

Bitcoin Weekly Forecast: BTC’s next breakout could propel it to $80,000 Premium

Bitcoin Weekly Forecast: BTC’s next breakout could propel it to $80,000

Bitcoin’s recent price consolidation could be nearing its end as technical indicators and on-chain metrics suggest a potential upward breakout. However, this move would not be straightforward and could punish impatient investors. 

Read more

US core PCE inflation set to signal firm price pressures as markets delay Federal Reserve rate cut bets

US core PCE inflation set to signal firm price pressures as markets delay Federal Reserve rate cut bets

The core PCE Price Index, which excludes volatile food and energy prices, is seen as the more influential measure of inflation in terms of Fed positioning. The index is forecast to rise 0.3% on a monthly basis in March, matching February’s increase. 

Read more

Majors

Cryptocurrencies

Signatures