Happy Cinco De Mayo

USD: Jun '25 is Down at 99.445.
Energies: Jun '25 Crude is Down at 57.39.
Financials: The Jun '25 30 Year T-Bond is Lower by 2 ticks and trading at 114.27.
Indices: The Jun '25 S&P 500 emini ES contract is 173 ticks Lower and trading at 5665.50.
Gold: The Jun'25 Gold contract is trading Up at 3320.90.
Initial conclusion
This is not a correlated market. The USD is Down and Crude is Down which is not normal, and the 30 Year T-Bond is trading Lower fractionally. The Financials should always correlate with the US dollar such that if the dollar is Higher, then the bonds should follow and vice-versa. The S&P is Lower and Crude is trading Lower which is not correlated. Gold is trading Higher which is correlated with the US dollar trading Down. I tend to believe that Gold has an inverse relationship with the US Dollar as when the US Dollar is down, Gold tends to rise in value and vice-versa. Think of it as a seesaw, when one is up the other should be down. I point this out to you to make you aware that when we don't have a correlated market, it means something is wrong. As traders you need to be aware of this and proceed with your eyes wide open. Asia traded Higher except the Shanghai exchange. Europe is trading Mixed.
Possible challenges to traders
-
Final Services PMI is out at 9:45 AM EST. This is Major.
-
ISM Services PMI is out at 10 AM EST. This is Major.
-
Loan Officer Survey - tentative. This is Major.
Traders, please note that we've changed the Bond instrument from the 10 Year (ZN) to the 2 Year (ZT). They work exactly the same.
We've elected to switch gears a bit and show correlation between the 2-year Treasury notes (ZT) and the S&P futures contract. The YM contract is the Dow Jones Industrial Average, and the purpose is to show reverse correlation between the two instruments. Remember it's likened to a seesaw, when up goes up the other should go down and vice versa.
On Friday the ZT dived Lower at around 8:30 AM EST with the Jobs Numbers pending. The Dow leaped Higher at the same time. Look at the charts below and you'll see a pattern for both assets. The Dow moved Higher at 8:30 AM EST and the ZT moved Lower at around the same time. These charts represent the newest version of Bar Charts, and I've changed the timeframe to a 15-minute chart to display better. This represented a Short opportunity on the 2-year note, as a trader you could have netted 30 plus ticks per contract on this trade. Each tick is worth $6.25. Please note: the front month for ZT is now Jun '25 and the Dow is Jun '25 as well. I've changed the format to filled Candlesticks (not hollow) such that it may be more apparent and visible.
Charts courtesy of BarCharts
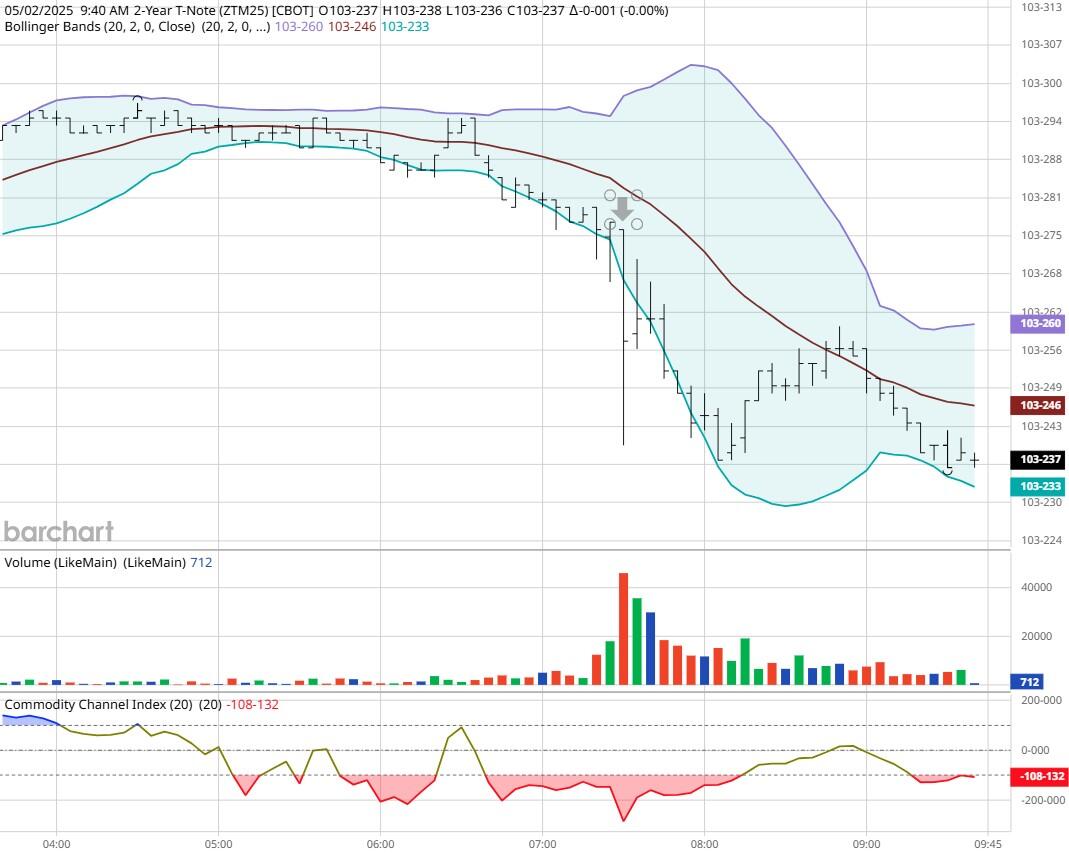
ZT -Jun 2025 - 5/02/25
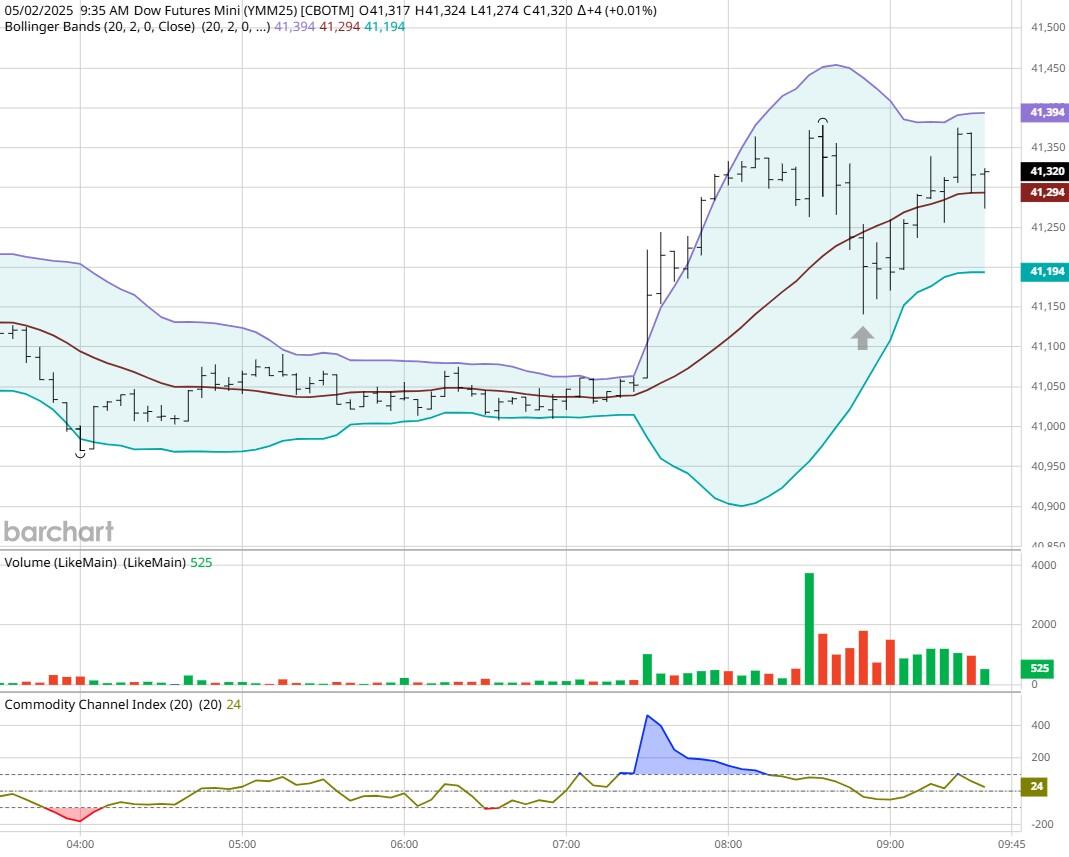
Dow - Mar 2025- 5/02/25
Bias
On Friday we gave the markets a Neutral bias as it was Jobs Friday and we always maintain a Neutral or Mixed bias on that day as the markets have never shown any sense of normalcy. The Dow traded Higher by 564 points and the other indices closed Higher as well. Today we aren't dealing with a correlated market, and our bias is to the Downside.
Could this change? Of Course. Remember anything can happen in a volatile market.
Commentary
So Friday we had Jobs numbers for March, and it appears that the US economy created 177,000 new jobs versus 138,000 estimated. I have no doubt that this administration will claim credit for that although the day before they blamed the previous administration for the deplorable economic news reported. Want to learn Market Correlation and determine market direction hours before the Opening Bell?
Author

Nick Mastrandrea
Market Tea Leaves


