GX Uranium ETF Elliott Wave technical analysis [Video]
![GX Uranium ETF Elliott Wave technical analysis [Video]](https://editorial.fxstreet.com/images/Markets/Commodities/Metals/metal-shavings-gm133537548-17887573_XtraLarge.jpg)
GX Uranium ETF Elliott Wave analysis
The Global X Uranium ETF (GX URA) provides investors exposure to the uranium sector, tracking companies engaged in uranium mining, exploration, and production globally. As nuclear energy gains traction as a cleaner power source, uranium demand could rise, positioning the GX URA ETF as an appealing opportunity for investors interested in the sector's potential growth.
Long-term Elliott Wave analysis
Looking at the GX URA ETF through an Elliott Wave lens, the ETF appears to be in a prolonged bullish correction after a notable downtrend. Between February 2011 and March 2020, the price consistently declined, forming lower lows and lower highs, which fit an extended impulse wave pattern. This downtrend culminated in March 2020, after which the price began a recovery sequence.
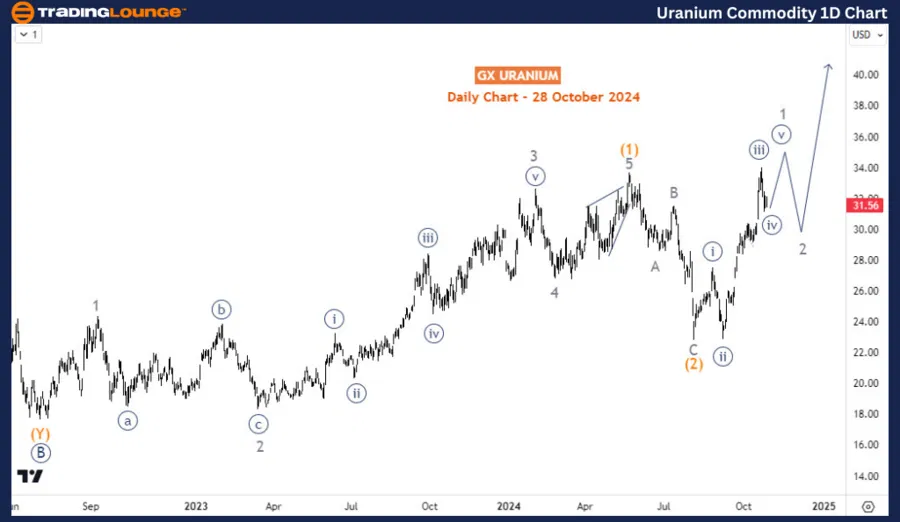
Daily chart analysis
Following this low, the ETF completed an impulsive wave A (circled) of the primary degree by November 2021, marking the first phase of a larger corrective structure. A corrective pullback was then developed for wave B (circled) and ended in July 2022. From there, an impulsive wave structure took shape for wave (1) of C (circled), culminating in May 2024. A pullback followed, forming wave (2) as shown on the daily chart. Currently, the rally that began on August 5, 2024, is likely the start of wave 1 of (3), signaling the next phase of the bullish recovery. With wave 1 still developing, significant upside potential remains as the correction unfolds.
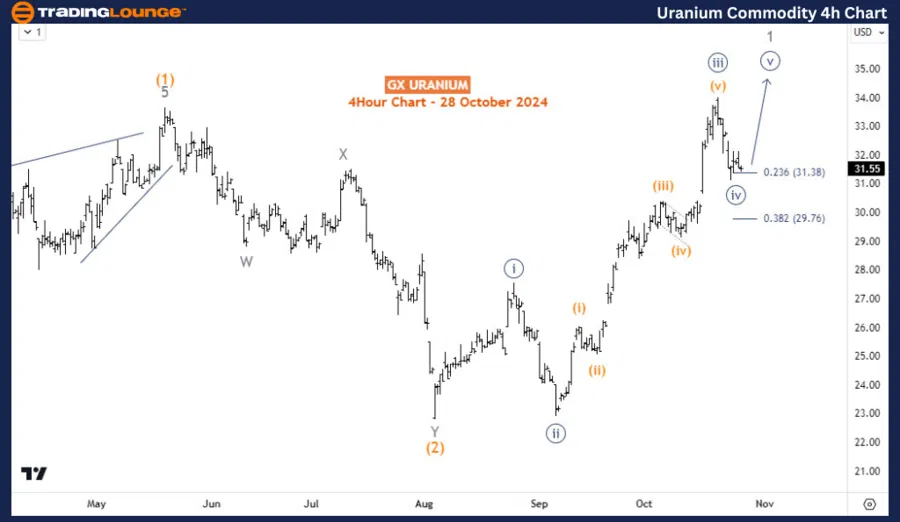
Four-hour chart analysis
Zooming into the H4 timeframe, the impulsive recovery from August 5th surpassed the high of wave (1), confirming that wave (3) is underway after the completion of wave (2) at August's low. This recent surge aligns with wave 1 of (3) as anticipated, though wave 1 remains incomplete. Last week's pullback signals the ETF is currently in wave ((iv)) of 1, suggesting that one final upward push in wave ((v)) of 1 is likely before a more substantial pullback occurs in wave 2. This potential move offers promising opportunities for buyers as the long-term recovery takes shape.
GX Uranium ETF Elliott Wave technical analysis [Video]
Author

Peter Mathers
TradingLounge
Peter Mathers started actively trading in 1982. He began his career at Hoei and Shoin, a Japanese futures trading company.


