Grinding, grinding, stocks keeps rising

Every day, higher stock prices every day – sounds really nice? I bet it does for those not caught still on the short side of the market. While readings are getting a bit too exuberant, are they frothy enough to justify a long-awaited correction?
Let's check the charts and feel the pulse.
SP 500 in the Short-Run
I'll start with the daily chart perspective:
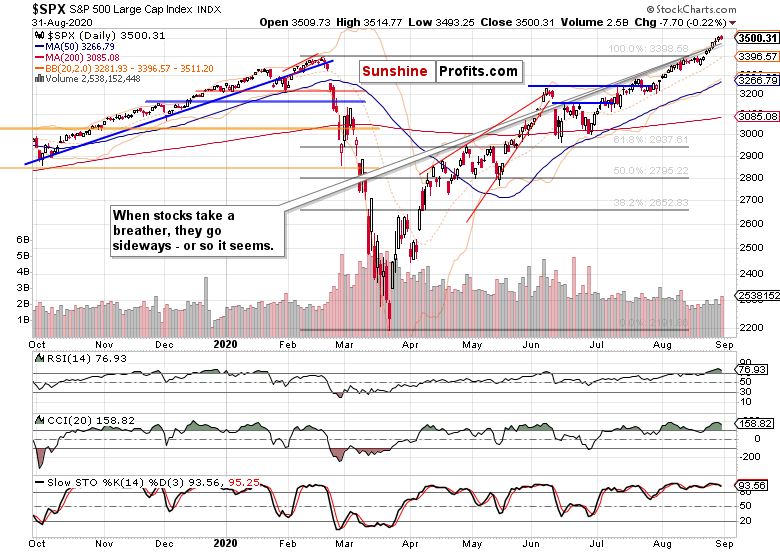
It's quite hard to pick a soft spot in the stocks rally, isn't it? The rising volume though indicates that a consolidation wouldn't be all too surprising. While I am not calling for September storms, I think that we're in for a leaner month than August was.
The Credit Markets' Point of View
High yield corporate bonds (HYG ETF) made a bearish move yesterday – rolling over on rising volume. But how bearish does it get? I see sideways consolidation not breaking below the mid-August lows as the most likely scenario. We're still in a predominantly risk-on environment, after all.
Investment grade corporate bonds (LQD ETF) recovered for second trading day in a row (please see this and many more charts at my home site). The Fed-induced selloff was a bit too heavy, and I continue to look tor LQD to outperform long-dated Treasuries in the very short run.
And they indeed look set to do so, as more money out of the deepest bond market around, moves into the stock market.
Gold, Copper and Technology
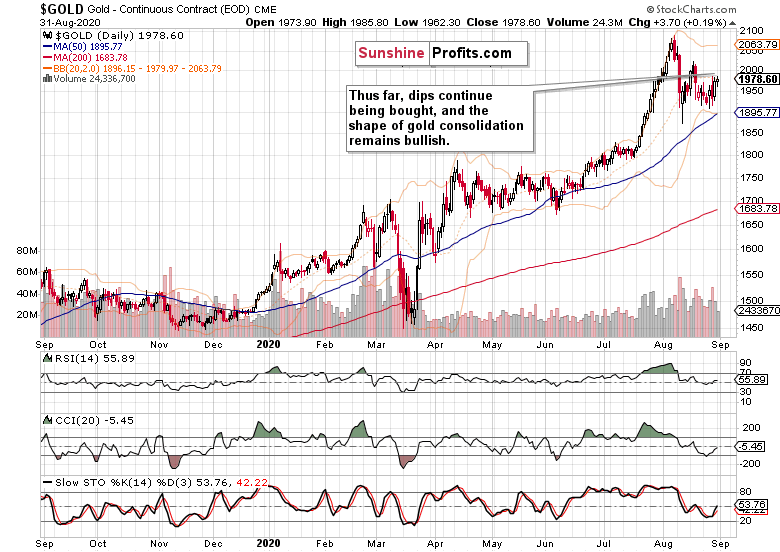
Going sideways, and forming what could very well turn out to be a bullish flag in the end. No challenge of the summer lows just as I called for almost a month ago. The sell-the-news reaction to the new Fed approach towards inflation, is over – the yellow metal attempts to extend modest daily gains. That supports the no squeeze ahead hypothesis.
Copper confirms the bullish bias, and casts a vote in favor of the recovery. Best of all, neither the red metal nor commodities ($CRB) are overheating.
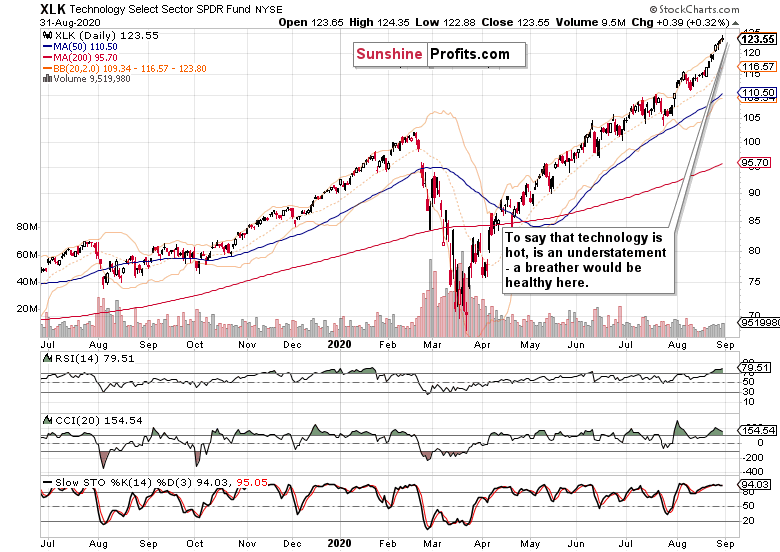
Technology (XLK ETF) keeps powering higher like there's no tomorrow, but the upper shadow on rising volume could pause it in the short run. Could and short run, these are the key words here. The chart is primed to go much higher, and who could responsibly call for a profound reversal? Not me, as in the current sad state of the real economy, tech stands ready to benefit the most.
From the Readers' Mailbag
Q: Hi Monica, first my compliment for your analysis.. one question, do you never follow the Cot Report to analyze the position of the small trader, large trader and commercial trader?? I follow a topic of an italian trader, who is always long from 2008 just following the Cot Report. he always say that is the only way to know what the big investor (commercial trader) are doing. Also he always say that until the small traders (all people like me...) and large traders are short, the market can go only up... commercial traders will protect the market. And looking what is happened in all these 12 years, I can say he is right until now. What do you think about that? About the Cot Report? is a reliable information to know what direction the market is taking?? thank you so much for any your comment/opinion.
A: Thank you very much, I am glad you're appreciating my writings. I like the sentiment readings and constituent parts of the fear and greed index much more. It's that the commitment of traders report has to a large extent lost its analytical edge over the recent decades, not just years.
We're living in many bubbles, and I won't mention any of the Fed-blown ones, or allude to the everything bubble – I'll say merely two words: passive investing. That's a bubble in its own right, or who in their right mind would buy into quite a few of the nosebleed P/E valuations? It makes one redefine what the smart money actually is, because that has changed.
Ignoring the macroeconomics would have been painful for that Italian trader – the flash crash of 2010 followed by 2011 when it looked we're headed for a recession. Or who could forget the summer of 2015 and early 2016?
I use a much broader mix of tools that I more or less regularly discuss in my daily public analyses (reading them over weeks and months brings out the most value into the open) – and the same goes for narratives that power the markets, or make them turn. The CoT one sounds coherent logically, but the practical application is troublesome.
Besides, the only ones who I heard to protect the market, have been the central banks really – once their hand gets twisted really badly. That's an example of what I catch with the momentum part of my style. You know, there is a time for everything, and everything in moderation. Powerful wisdom for life too.
Apart from my thoughts as to CoT in stocks, take a look at the below view of CoT and precious metals.
Or check Warren Buffet and his value investing theory. Very successful in its own realm, but he didn't really get gold – and only now has bought into the king of metals, whose bull market of the 2000s decade and September 2011 top, outperformed Berkshire Hathaway.
My point is that we're living in very different times, and need to use a more rich and precise set of tools in getting the market moves right.
Summary
Summing up, the S&P 500 keeps extending gains, and so does the tech sector – but could be in for a pause. Volatility has picked up, smallcaps keep underperforming, and the put/call ratio is aiming for new lows. Short-term vulnerability to a sideways-to-down move in stocks has risen in probability, but the market character remains bullish, very bullish.
Want free follow-ups to the above article and details not available to 99%+ investors? Sign up to our free newsletter today!
Want free follow-ups to the above article and details not available to 99%+ investors? Sign up to our free newsletter today!
Author

Monica Kingsley
Monicakingsley
Monica Kingsley is a trader and financial analyst serving countless investors and traders since Feb 2020.


