Greenland comments propel markets

USD: Mar '26 is Down at 98.420.
Energies: Feb '26 Crude is Down at 59.55.
Financials: The Mar '26 30 Year T-Bond is Lower by 1 tick and trading at 114.30.
Indices: The Mar '26 S&P 500 emini ES contract is 160 ticks Higher and trading at 6950.00
Gold: The Feb'26 Gold contract is trading Up at 4832.20.
Initial conclusion
This is a nearly correlated market. The USD is Down and Crude is Down which is not normal, and the 30 Year T-Bond is trading Lower. The Financials should always correlate with the US dollar such that if the dollar is Higher, then the bonds should follow and vice-versa. The S&P is Higher and Crude is trading Lower which is correlated. Gold is trading Higher which is correlated with the US dollar trading Down. I tend to believe that Gold has an inverse relationship with the US Dollar as when the US Dollar is down, Gold tends to rise in value and vice-versa. Think of it as a seesaw, when one is up the other should be down. I point this out to you to make you aware that when we don't have a correlated market, it means something is wrong. As traders you need to be aware of this and proceed with your eyes wide open. All of Asia traded Higher. Currently all of Europe is trading Higher as well.
Possible challenges to traders
- Final GDP q/q is out at 8:30 AM EST. This is Major.
- Final GDP Price Index is out at 8:30 AM EST. This is Major.
- Unemployment Claims are out at 8:30 AM EST. This is Major.
- Core PCE Price Index m/m is out at 10 AM EST. This is Major.
- Personal Income m/m is out at 10 AM EST. This is Major.
- Personal Spending m/m is out at 10 AM EST. This is Major.
- Natural Gas Storage is out at 10:30 AM EST. This is Major.
- Crude Oil Inventories is out at 12 PM EST. This is Major.
Traders, please note that we've changed the Bond instrument from the 10 Year (ZN) to the 2 Year (ZT). They work exactly the same.
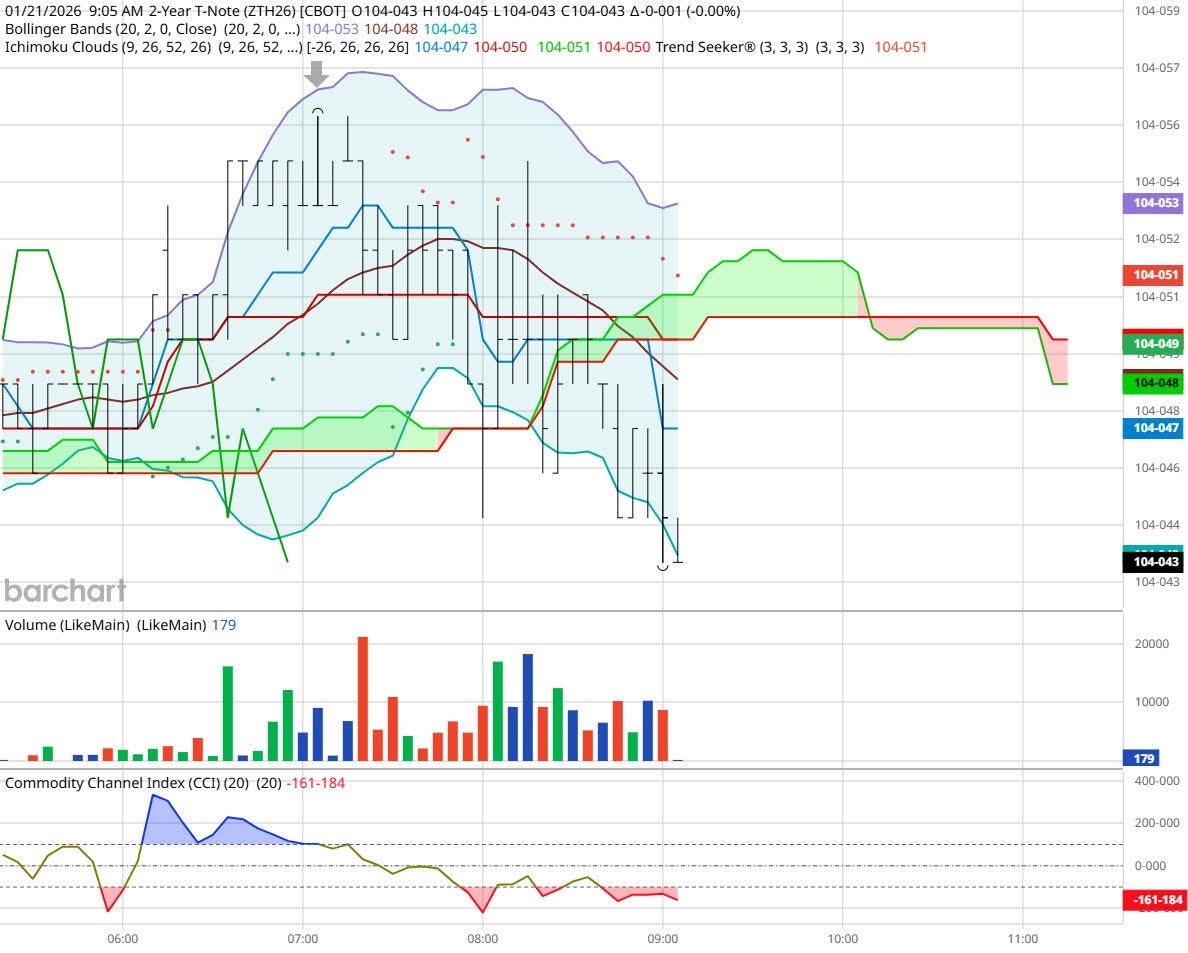
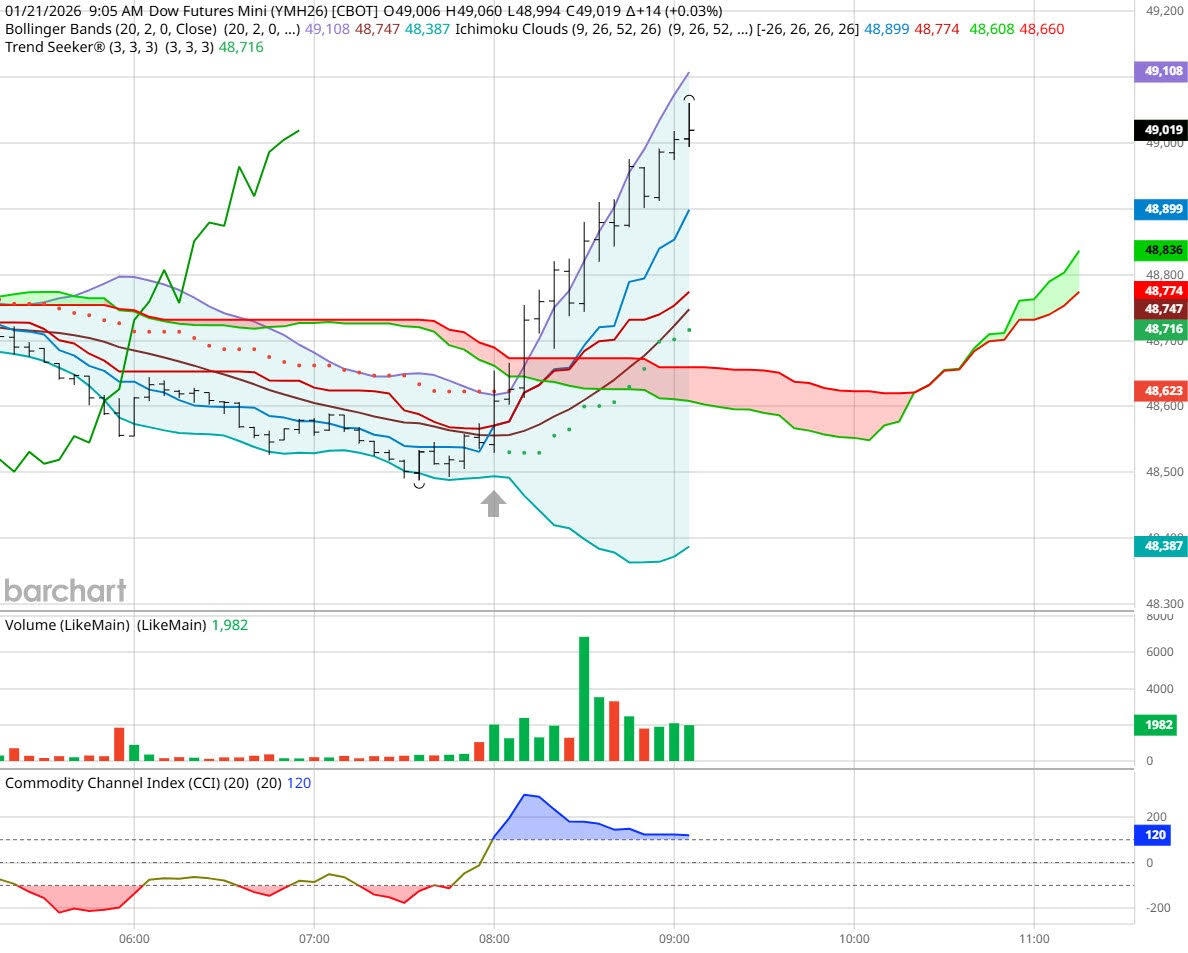
We've elected to switch gears a bit and show correlation between the 2-year Treasury notes (ZT) and the S&P futures contract. The YM contract is the Dow Jones Industrial Average, and the purpose is to show reverse correlation between the two instruments. Remember it's likened to a seesaw, when up goes up the other should go down and vice versa.
Yesterday the ZT dived Lower at around 8 AM EST, waiting for President Trump to address the Davos meeting. The Dow climbed Higher at around the same time. Look at the charts below, and you'll see a pattern for both assets. The ZT dived Lower at around 8 AM EST and the Dow climbed Higher at around the same time. These charts represent the newest version of Bar Charts, and I've changed the timeframe to a 15-minute chart to display better. This represented a Short opportunity on the 2-year note, as a trader, you could have netted about a dozen plus ticks per contract on this trade. Each tick is worth $6.25. Please note: the front months for the ZT and YM are both Mar '26. I've changed the format to filled Candlesticks (not hollow) such that it may be more apparent and visible.
Charts courtesy of barcharts
Bias
Yesterday we gave the markets a Neutral or Mixed bias, but the markets veered to the Upside after a lower start. The Dow leapt Higher by 285 points and the other indices closed Higher as well. Today we are dealing with a nearly correlated market, and it's correlated to the Upside.
Could this change? Of Course. Remember anything can happen in a volatile market.
Commentary
Yesterday President Trump made it very clear that he wants Greenland, but the saving grace was he claimed that military action was off the table. The markets responded positively to this, and all the indices closed Higher.
Author

Nick Mastrandrea
Market Tea Leaves


