|

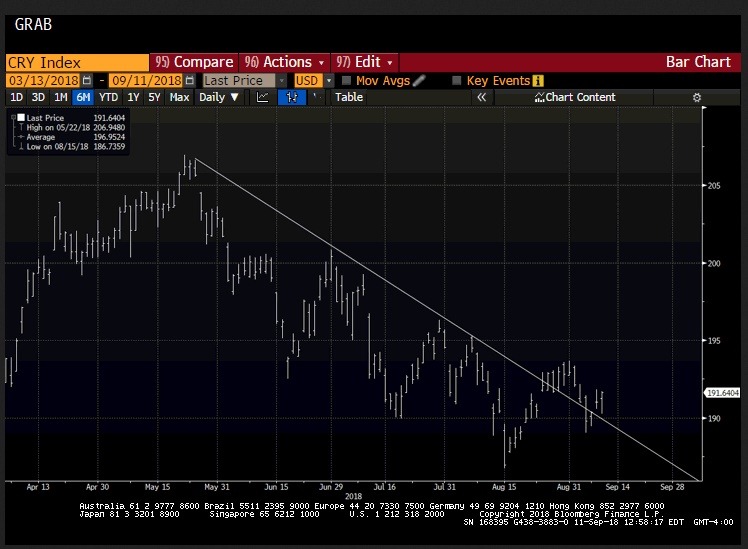
Great Graphic: Did the CRB Bottom?

The CRB index has been trending lower since late May. It fell nearly 10% to retrace 50% of the rally come June 2017. This Great Graphic shows the 4 1/2 month trendline. It had been violated in late August but fell back under it at the end of last week.  

On Monday, it gapped higher, above the trendline. Today it filled the gap and rallied to new session highs. A move above 192.00 would likely confirm a bottom of some importance is in place. The technical readings on the weekly bar charts are more constructive than the dailies.  

The commodities in the basket are mostly traded in US dollars. Typically, then when the dollar is strong, one generally expects lower commodity prices and vice versa. On a purely directional basis, the CRB Index and the Dollar Index have an inverse correlation of -0.65 over the past 60 days. Since 2016, the inverse correlation has rarely been stronger. This would suggest that the next move may have a weaker inverse correlation. That is to say that a favorable near-term technical outlook for the CRB Index may not have significant implications for the Dollar Index, even if there is a small negative bias. 

Grab

Author

Marc Chandler

Marc Chandler

Marc to Market

Experience Marc Chandler's first job out of school was with a newswire and he covered currency futures and Eurodollar and Tbill futures.

More from Marc Chandler
Share:

Editor's Picks

EUR/USD hits two-day highs near 1.1820

EUR/USD picks up pace and reaches two-day tops around 1.1820 at the end of the week. The pair’s move higher comes on the back of renewed weakness in the US Dollar amid growing talk that the Fed could deliver an interest rate cut as early as March. On the docket, the flash US Consumer Sentiment improves to 57.3 in February.

GBP/USD reclaims 1.3600 and above

GBP/USD reverses two straight days of losses, surpassing the key 1.3600 yardstick on Friday. Cable’s rebound comes as the Greenback slips away from two-week highs in response to some profit-taking mood and speculation of Fed rate cuts. In addition, hawkish comments from the BoE’s Pill are also collaborating with the quid’s improvement.

Gold climbs further, focus is back to 45,000

Gold regains upside traction and surpasses the $4,900 mark per troy ounce at the end of the week, shifting its attention to the critical $5,000 region. The move reflects a shift in risk sentiment, driving flows back towards traditional safe haven assets and supporting the yellow metal.

Crypto Today: Bitcoin, Ethereum, XRP rebound amid risk-off, $2.6 billion liquidation wave

Bitcoin edges up above $65,000 at the time of writing on Friday, as dust from the recent macro-triggered sell-off settles. The leading altcoin, Ethereum, hovers above $1,900, but resistance at $2,000 caps the upside. Meanwhile, Ripple has recorded the largest intraday jump among the three assets, up over 10% to $1.35.

Three scenarios for Japanese Yen ahead of snap election

The latest polls point to a dominant win for the ruling bloc at the upcoming Japanese snap election. The larger Sanae Takaichi’s mandate, the more investors fear faster implementation of tax cuts and spending plans. 

XRP rally extends as modest ETF inflows support recovery

Ripple is accelerating its recovery, trading above $1.36 at the time of writing on Friday, as investors adjust their positions following a turbulent week in the broader crypto market. The remittance token is up over 21% from its intraday low of $1.12.