GOP blocks debt ceiling [Video]
![GOP blocks debt ceiling [Video]](https://editorial.fxstreet.com/images/Markets/Currencies/Majors/DollarIndex/portraits-of-u-s-presidents-on-dollar-bills-gm465128326-59608952_XtraLarge.jpg)
US Dollar: Dec '21 USD is Up at 93.805.
Energies: Nov '21 Crude is Down at 74.65.
Financials: The Dec '21 30 Year bond is Up 14 ticks and trading at 159.24.
Indices: The Dec '21 S&P 500 emini ES contract is 112 ticks Higher and trading at 4372.00.
Gold: The Dec'21 Gold contract is trading Up at 1743.00. Gold is 55 ticks Higher than its close.
Initial conclusion
This is not a correlated market. The dollar is Up and Crude is Down which is normal and the 30 year Bond is trading Higher. The Financials should always correlate with the US dollar such that if the dollar is lower then bonds should follow and vice-versa. The S&P is Higher and Crude is trading Lower which is correlated. Gold is trading Higher which is not correlated with the US dollar trading Up. I tend to believe that Gold has an inverse relationship with the US Dollar as when the US Dollar is down, Gold tends to rise in value and vice-versa. Think of it as a seesaw, when one is up the other should be down. I point this out to you to make you aware that when we don't have a correlated market, it means something is wrong. As traders you need to be aware of this and proceed with your eyes wide open. Currently Asia is trading Lower with the exception of the Hang Seng exchange which is Higher. All of Europe is trading Higher at this time.
Possible challenges to traders today
-
Pending Home Sales is out at 10 AM EST. This is Major.
-
Crude Oil Inventories is out at 10:30 AM EST. This is Major.
-
Fed Chair Powell Speaks at 11:45 AM EST. This is Major.
-
FOMC Member Bostic Speaks at 2 PM EST. This is Major.
Treasuries
Traders please note that we've changed the Bond instrument from the 30 year (ZB) to the 10 year (ZN). They work exactly the same.
We've elected to switch gears a bit and show correlation between the 10 year bond (ZN) and The S&P futures contract. The S&P contract is the Standard and Poor's and the purpose is to show reverse correlation between the two instruments. Remember it's liken to a seesaw, when up goes up the other should go down and vice versa.
Yesterday the ZN made it's move at around 10 AM EST. The ZN hit a Low at around that time and the S&P moved Lower. If you look at the charts below ZN gave a signal at around 10 AM EST and the S&P moved Lower at around the same time. Look at the charts below and you'll see a pattern for both assets. ZN hit a Low at around 10 AM EST and the S&P was moving Lower shortly thereafter. These charts represent the newest version of MultiCharts and I've changed the timeframe to a 15 minute chart to display better. This represented a Long opportunity on the 10 year note, as a trader you could have netted about 20 plus ticks per contract on this trade. Each tick is worth $15.625. Please note: the front month for the ZN is now Dec '21. The S&P contract is now Dec '21 as well. I've changed the format to Renko bars such that it may be more apparent and visible.
Charts Courtesy of MultiCharts built on an AMP platform
ZN - Dec 2021 - 9/28/21
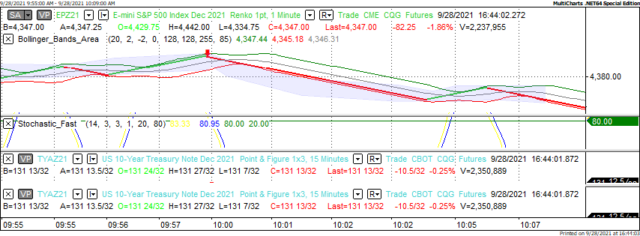
S&P - Dec 2021 - 9/28/21
Bias
Yesterday we gave the markets a Neutral bias as we didn't see much in the way of clear correlation Tuesday morning. The Dow closed lower by 569 points and the other indices traded Lower as well. Today we aren't dealing with a correlated market and our bias is Neutral.
Could this change? Of Course. Remember anything can happen in a volatile market.
Commentary
Monday evening we discovered that the GOP in DC decided to block a bill designed to raise the US Government's Debt Ceiling such that the USA can avoid a shutdown come October. If this does come to pass it would the first time in American history that the USA may default on loans and borrowing mat come to a halt. It would also mean that government employees would be furloughed and the government would be behind in Social Security payments. This would in effect ruin the stellar reputation that the United States has enjoyed for over two centuries. For those who may wonder why I harp on government themes lately; it is because the actions in DC are affecting the financial markets. Want proof? Look at what happened yesterday. Enough said.
Author

Nick Mastrandrea
Market Tea Leaves


