Goog stock could offer 10% discount after pullback
-
Alphabet Inc (Goog) is building a bearish retracement within a strong uptrend. Our article reviews the key bull and bear lines.
-
The decision zone will determine whether a deeper pullback against the trend will take place. Or will the bulls manage to continue higher in the trend.
-
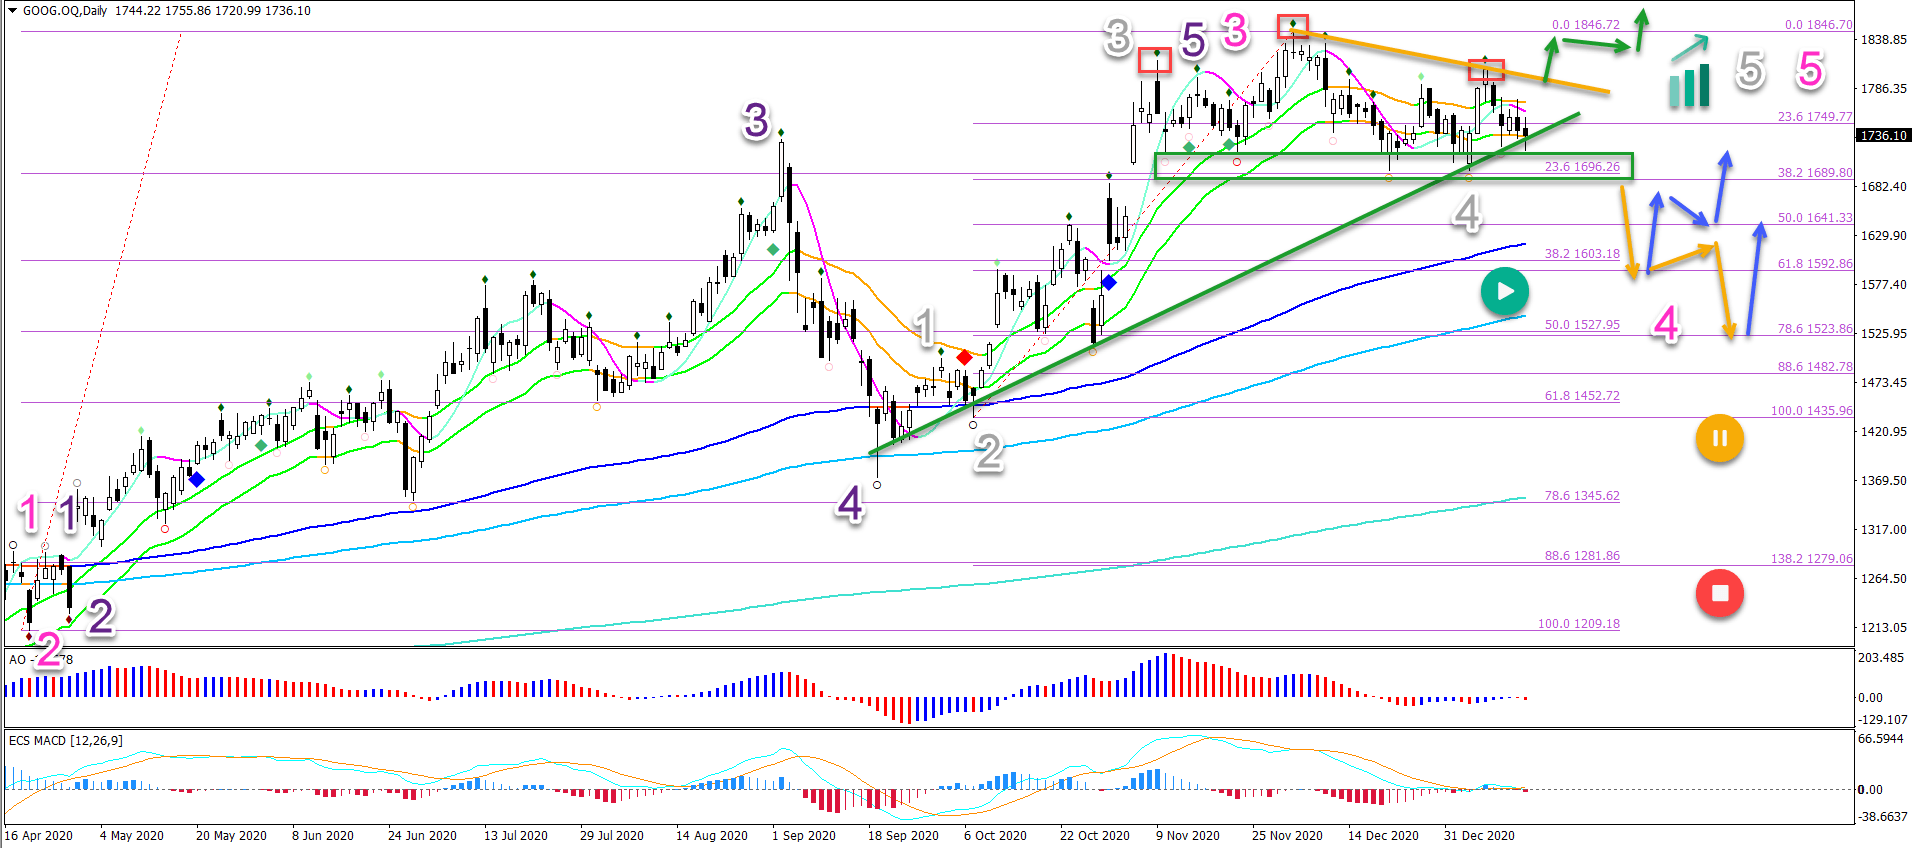
The GOOG stock is showing a head and shoulders reversal chart pattern (red boxes). The support line (green) is the main decision zone for a potential reversal.

Price Charts and Technical Analysis
The GOOG stock is showing a head and shoulders reversal chart pattern (red boxes). The support line (green) is the main decision zone for a potential reversal.
-
A bearish breakout (orange arrows) confirms the deeper bearish retracement towards the long-term moving averages and Fibonacci levels.
-
It also confirms the deeper wave 4 (pink) development rather than the shallower wave 4 (grey).
-
An immediate breakout (green arrows) above the resistance (orange) indicates a potential uptrend continuation.
-
The Fibs are expected to act as a bouncing spot (blue arrows).
-
Only a deeper retracement places the uptrend in question (yellow & red circles).
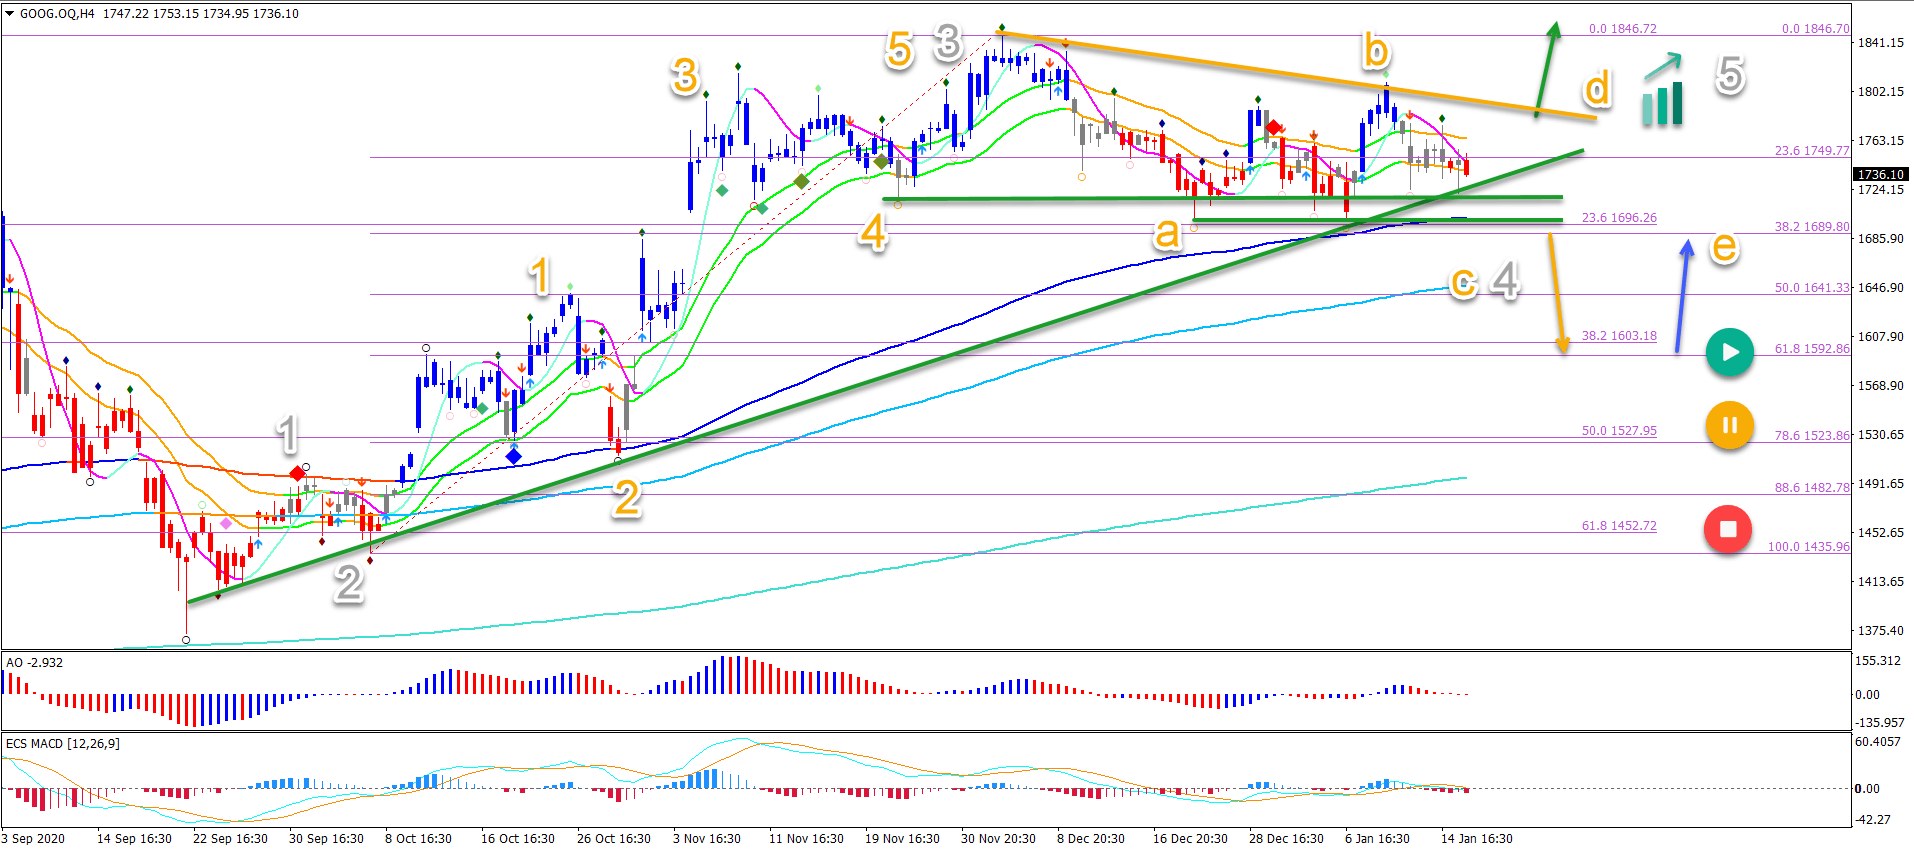
On the 4 hour chart, the sideways price action is an ABC (orange) pattern. The main question is whether the ABC pattern is complete OR will price action expand it.
-
The end of the ABC is confirmed by a bullish breakout.
-
The continuation of the ABC pattern can take place with 2 variants:
-
ABCDE triangle chart pattern
-
Deeper ABC retracement after bearish breakout
-
In all cases, an uptrend is expected eventually. Unless price pushes below the $1,500 round level.
The analysis has been done with the ecs.SWAT method and ebook.
Author

Chris Svorcik
Elite CurrenSea
Experience Chris Svorcik has co-founded Elite CurrenSea in 2014 together with Nenad Kerkez, aka Tarantula FX. Chris is a technical analyst, wave analyst, trader, writer, educator, webinar speaker, and seminar speaker of the financial markets.


