Good jobs report doesn’t move markets [Video]
![Good jobs report doesn’t move markets [Video]](https://editorial.fxstreet.com/images/TechnicalAnalysis/Intermarket/Correlation/it-must-work-gm537868515-58464346_XtraLarge.jpg)
US Dollar: Dec '22 USD is Up at 104.620.
Energies: Jan '23 Crude is Up at 81.71.
Financials: The Mar '23 30 Year T-Bond is Down 1 tick and trading at 129.24.
Indices: The Dec '22 S&P 500 emini ES contract is 72 ticks Lower and trading at 4057.50.
Gold: The Feb'23 Gold contract is trading Down at 1808.30. Gold is 13 ticks Lower than its close.
Initial conclusion
This is not a correlated market. The dollar is Up, and Crude is Up which is not normal, but the 30 Year T-Bond is trading Lower. The Financials should always correlate with the US dollar such that if the dollar is lower, then the bonds should follow and vice-versa. The S&P is Lower, and Crude is trading Higher which is correlated. Gold is trading Lower which is correlated with the US dollar trading Up. I tend to believe that Gold has an inverse relationship with the US Dollar as when the US Dollar is down, Gold tends to rise in value and vice-versa. Think of it as a seesaw, when one is up the other should be down. I point this out to you to make you aware that when we don't have a correlated market, it means something is wrong. As traders you need to be aware of this and proceed with your eyes wide open. Currently all of Asia is trading Higher with the exception of the Indian Sensex exchange. Conversely all of Europe is trading Lower with the exception of the London exchange which is Higher.
Possible challenges to traders today
-
Final Services PMI is out at 9:45 AM EST. This is Major.
-
ISM Services PMI is out at 10 AM EST. Major.
-
Factory Orders is out at 10 AM EST. Major.
Treasuries
Traders, please note that we've changed the Bond instrument from the 30 year (ZB) to the 10 year (ZN). They work exactly the same.
We've elected to switch gears a bit and show correlation between the 10-year bond (ZN) and the S&P futures contract. The S&P contract is the Standard and Poor's, and the purpose is to show reverse correlation between the two instruments. Remember it's likened to a seesaw, when up goes up the other should go down and vice versa.
On Friday the Bonds hit a Low at around 10:30 AM EST. The S&P hit a High at around that time and the Bonds moved Higher shortly thereafter. If you look at the charts below ZN gave a signal at around 10:30 AM and the S&P gave a signal at around the same time. Look at the charts below and you'll see a pattern for both assets. ZN hit a Low at around 10:30 AM and the S&P moved Lower shortly thereafter. These charts represent the newest version of MultiCharts and I've changed the timeframe to a 15-minute chart to display better. This represented a Long opportunity on the 10-year note, as a trader you could have netted about 30 ticks per contract on this trade. Each tick is worth $15.625. Please note: the front month for the ZN is now Dec '22. The S&P contract is also Dec' 22. I've changed the format to Renko Bars such that it may be more apparent and visible.
Charts courtesy of MultiCharts built on an AMP platform
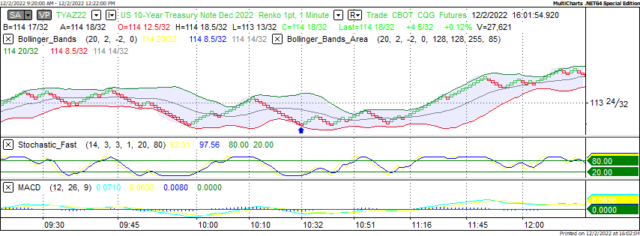
ZN - Dec 2022 - 12/02/22
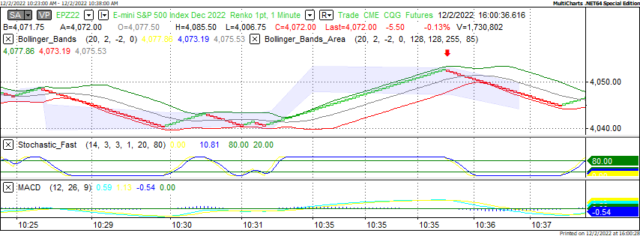
S&P - Dec 2022 - 12/02/22
Bias
Last Friday we gave the markets a Neutral bias as it was Jobs Friday, and we always maintain a Neutral bias on that day. Why? Because the markets have never shown any sense of normalcy on that day. The Dow gained 35 points, but the other indices dropped. Today we aren't dealing with a correlated market and our bias is to the Downside.
Could this change? Of Course. Remember anything can happen in a volatile market.
Commentary
Last Friday Non-Farm Payrolls was reported at 8:30 AM EST and what was a stellar report didn't help the markets much. The report came in with 263,000 net new jobs created versus 200,000 expected. This was a great report and showed a still very strong labor market, so what happened? What happened was Wall Street is afraid that the Federal Reserve will continue to hike interest rates aggressively as opposed to taking a more mellow approach. As of late the Fed has been raising rates at three quarters of a point but after Chairman Powell spoke this past week it is assumes that rate hikes would be more liken to a half point or possibly quarter point increments. Now the Street and the Smart Money aren't too sure which led to a selloff Friday. Not a major one to be sure but the markets didn't advance across the board as it should have. Today we have Factory Orders out at 10 AM EST. This is Major. Could this move the markets? Only time will tell...
Author

Nick Mastrandrea
Market Tea Leaves


