Good eco news doesn’t do it [Video]
![Good eco news doesn’t do it [Video]](https://editorial.fxstreet.com/images/Markets/Currencies/Majors/DollarIndex/rows-of-dollars-bundles-background-19722556_XtraLarge.jpg)
US Dollar: Dec '20 USD Down at 92.775.
Energies: Nov'20 Crude is Down at 40.76.
Financials: The Dec '20 30 year bond is Down 5 ticks and trading at 172.04.
Indices: The Dec S&P 500 emini ES contract is 138 ticks Higher and trading at 3567.00.
Gold: The Dec'20 Gold contract is trading Up at 1878.60 Gold is 52 ticks Higher than its close.
Initial Conclusion
This is not a correlated market. The dollar is Down- and Crude is Down- which is not normal and the 30 year Bond is trading Lower. The Financials should always correlate with the US dollar such that if the dollar is lower then bonds should follow and vice-versa. The S&P is Higher and Crude is trading Lower which is correlated. Gold is trading Higher which is correlated with the US dollar trading Down-. I tend to believe that Gold has an inverse relationship with the US Dollar as when the US Dollar is down, Gold tends to rise in value and vice-versa. Think of it as a seesaw, when one is up the other should be down. I point this out to you to make you aware that when we don't have a correlated market, it means something is wrong. As traders you need to be aware of this and proceed with your eyes wide open.
Asia traded mainly Lower with the exception of the Indian Sensex exchange. Currently all of Europe is trading Higher with the exception of the London Exchange which is Lower at this point.
Possible Challenges To Traders Today
-
Core PPI is out at 8:30 AM EST. This is Major.
-
PPI is out at 8:30 AM EST. This is Major.
-
Prelim UoM Consumer Sentiment is out at 10 AM EST. Major.
-
Prelim UoM Inflation Expectations is out at 10 AM EST. Major
-
Natural Gas Storage are out at 10:30 AM EST. Major.
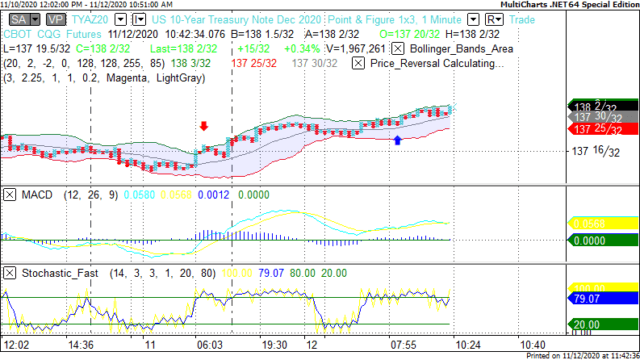
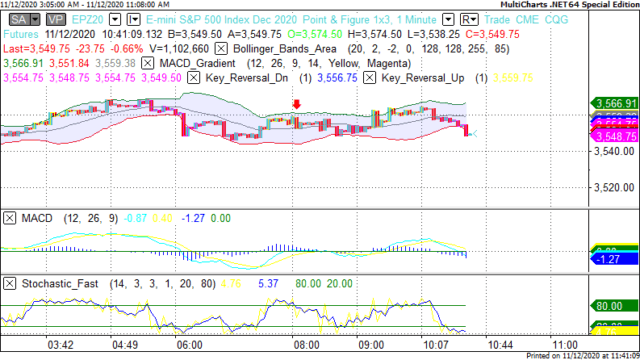
Treasuries
Traders please note that we've changed the Bond instrument from the 30 year (ZB) to the 10 year (ZN). They work exactly the same.
We've elected to switch gears a bit and show correlation between the 10 year bond (ZN) and The S&P futures contract. The S&P contract is the Standard and Poor's and the purpose is to show reverse correlation between the two instruments. Remember it's liken to a seesaw, when up goes up the other should go down and vice versa.
Yesterday the ZN made it's move at around 8 AM EST. The ZN hit a Low at around that time and the S&P moved Lower. If you look at the charts below ZN gave a signal at around 8 AM EST and the S&P moved Lower at around the same time. Look at the charts below and you'll see a pattern for both assets. ZN hit a Low at around 8 AM EST and the S&P was moving Lower shortly thereafter. These charts represent the newest version of MultiCharts and I've changed the timeframe to a 15 minute chart to display better. This represented a Long opportunity on the 10 year note, as a trader you could have netted about 20 plus ticks per contract on this trade. Each tick is worth $15.625. Please note: the front month for the ZN is now Dec '20. The S&P contract is also Dec '20 as well. I've changed the format to Renko bars such that it may be more apparent and visible.
Charts Courtesy of MultiCharts built on an AMP platform
Bias
Yesterday we gave the markets a Neutral bias as we didn't see much in the way of correlation and the markets traded Lower. The Dow dropped 317 points and the other indices lost ground as well. Today we aren't dealing with a correlated market and our bias is to the Upside.
Could this change? Of Course. Remember anything can happen in a volatile market.
Commentary
Yesterday we did have economic news and in fact it was good economic news reported. CPI and Core CPI both in at zero which means consumer weren't paying higher prices this past month. Unemployment Claims came in less than expected at 709K versus 730K expected. However the markets didn't see it that way with the Dow, S&P and Nasdaq all coming in with losses. The only thing that makes any sense is this: the markets do not like uncertainty (which is an oxymoron because the markets are the most uncertain entities on the planet) and what is uncertain? The presidential election because Mr. Trump has not conceded the election yet and is digging in his heels hanging to any sense of victory even though there is none in sight. President Trump has denied President elect Biden any intel on any subject matter and in fact one Republican official has stated that Joe Biden will learn all that he can come January 20th. This is unfair and quite frankly despicable behavior. Four years ago President elect Trump was invited to the White House and given a full briefing on everything affecting the United States, this president has no such regard and is more concerned about being vindictive of his own loss.
Author

Nick Mastrandrea
Market Tea Leaves


