Gold’s weekly update: Bulls lead Gold’s price higher

Bulls with wide strides, are leading gold’s price in new record high levels. In today’s report on a fundamentals level, we are to have a look at whether the negative correlation of the USD with gold’s price is still active or not, also how the Fed’s interest rate decision affected gold’s price and finally what’s up for the week for gold traders. For a rounder view we are to conclude the report with a technical analysis of gold’s daily chart.
USD-Gold negative correlation seems inactive
We make a start by examining whether the negative correlation of gold’s price with the USD is currently is currently active or not. We have to note that on Monday the USD weakened against its counterparts and at the same day gold’s price was on the rise reaching new record high. Yet should one examine the overall movement of the two trading instruments over the past week, he/she could reach the conclusion that both trading instruments were on the rise signalling that their negative correlation is currently inactive. Also we note that US bond yields were on the rise since our last report yet at the same time failed to attract safe haven inflows from the precious metal as gold’s price also kept rising. The fact that both US yields and gold’s price were on the rise, tends to imply that investors may not be trusting the outlook of the US economy in order for them to divert funds from gold to US bonds, or even are not attracted to US bonds as the Fed is about to continue cutting rates further.
Dovish expectations for the Fed drive gold’s price higher
May be the key fundamental issue driving gold’s price higher was the Fed’s interest rate decision. The bank cut rates by 25 basis points as was expected last Wednesday. In its accompanying statement, the bank highlighted the elevated uncertainty for the economic outlook. It’s interesting that every Fed policymaker was in favour of the 25 basis points rate cut except of the newly appointed by US President Trump, Stephen Miran who favored a double rate cut. In its projections, the bank signaled that two more rate cuts are to come until the end of the year and another one is to follow in 2026 and seems relatively confident for the US economic outlook. A this point we would note that the market’s expectations are leaning on the dovish side. Also Fed Chairman Powell, stated that the near-term risk to inflation are on the upside. Overall, the Fed’s direction is now towards more monetary policy easing, yet the bank seems to be in no rush to cut rates further. The pace of further easing is expected to be heavily data dependent especially on the fields of inflation and employment, as the Fed’s dual mandate is to keep inflation low and steady and maximize employment. Gold traders are expected to keep a close eye on Fed Chairman Powell’s speech later today and should he signal more hesitation towards further easing of the bank’s monetary policy we may see gold’s price slipping and vice versa.
Upcoming financial releases
To conclude with fundamentals for gold’s price we would like to highlight two financial releases in the coming days that could affect gold’s direction. The first would be the release of the final US GDP Rates for Q2. Should the rates show a healthy growth rate for the US economy possibly surpassing the revised GDP rate for Q2 of 3.3%yy, we may see the release weighing on gold’s price. On the flip side should the rates slow down, implying that the US economy grew at a slower pace than initially expected, we may see market uncertainty for the US economy’s outlook intensifying driving gold’s price even higher. Also we highlight the release of the PCE rates for August. The headline rate is expected to tick up while forecasts are for the core rate to remain unchanged at 2.9%yy. Should the rates show that inflationary pressures in the US economy remain relatively resilient or even intensify, thus enhancing the Fed’s doubts to cut rates further, we may see gold’s price slipping. In the contrary should the rates slow down notably, implying and easing of inflationary pressures in the US economy thus adding more pressures on the Fed to ease its monetary policy further, we may see gold’s price getting further support.
Technical analysis
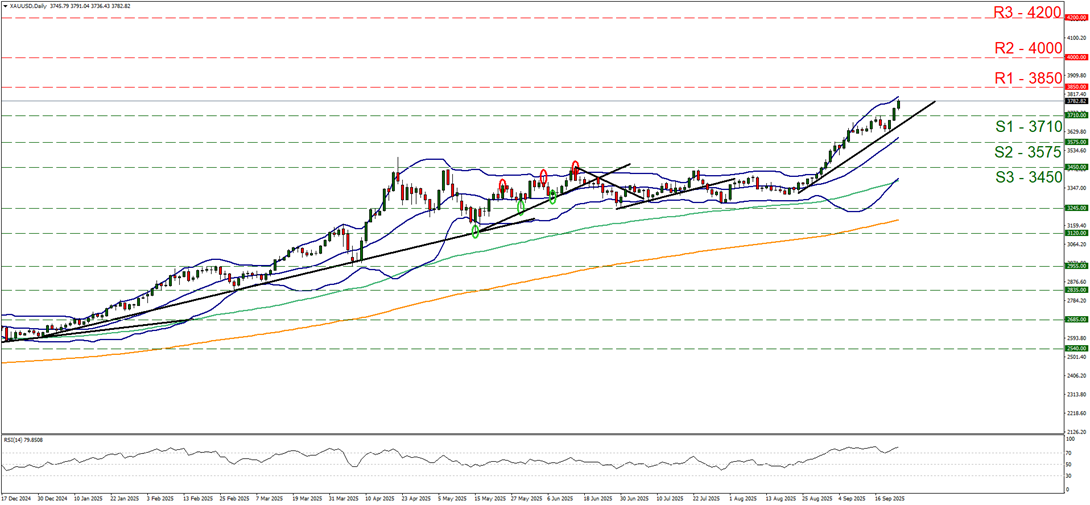
XAU/USD daily chart
-
Support: 3710 (S1), 3575 (S2), 3450 (S3).
-
Resistance: 3850 (R1), 4000 (R2), 4200 (R3).
Gold’s price rallied over the past two days and during today’s Asian and European sessions, breaking the 3710 (S1) resistance line now turned to support. It’s characteristic of the gold market’s bullish intentions currently, that the precious metal’s price has reached new all-time high (ATH) levels. We also note that the RSI indicator has bounced on the reading of 70 and is slightly rising implying a very strong market sentiment for the precious metal’s price, yet at the same time serves as a reminder for gold traders that gold’s price is at overbought levels and ripe for a correction lower. Similar signals are being sent by the fact that the price action is nearing the upper Bollinger band. Should the bulls continue to lead gold’s price higher, we may see it breaking the 3850 (R1) resistance line remain in charge of gold’s direction as expected, we may see it breaking the 3850 (R1) resistance line and we set as the next possible target for the bulls the 4000 (R2) resistance barrier. Should the bears take over, we may see gold’s price breaking the 3710 (S1) support level, continue to break the prementioned upward trendline, in a first signal that the upward motion of gold was interrupted again and continue to reach if not breach the 3575 (S2) support base.
Author

Peter Iosif, ACA, MBA
IronFX
Mr. Iosif joined IronFX in 2017 as part of the sales force. His high level of competence and expertise enabled him to climb up the company ladder quickly and move to the IronFX Strategy team as a Research Analyst. Mr.


